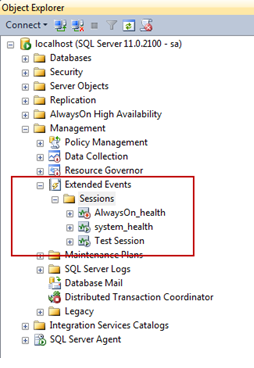
With SQL Server 2012 we introduced Always On Availability Groups, and the Always On Availability Group Dashboard in SQL Server Management Studio (SSMS). This dashboard can be utilized by database administrators to view the current health of an Availability Group and its availability replicas and databases. While the dashboard can be configured to provide information regarding the latency between Primary and Secondary Replicas (can be calculated using the Commit LSN, Sent LSN and harden LSN values), it does not provide insights into the reason for the latency. To understand the reason for latency, requires capture and analysis of Extended Events and Performance Monitor counters. This activity can be time consuming and requires extensive knowledge of the Extended Events associated with Always On.
With the new SSMS 17.4 release, we are introducing the Availability Group Latency data collection and reporting built into the Availability Group dashboard. This feature masks the capture and analysis of the Extended Events from the end user and provides an easy to understand report detailing the time spent during the various phases of the Log Transport process.
What to use it for?
The Latency data collection functionality and the associated reports allows a database administrator to quickly discern the bottleneck in the log transport flow between the Primary and the Secondary replicas of an Availability Group. This feature does NOT answer the question “Is there latency in the Availability Group deployment?” but rather provides a way to understand why there is latency in the Availability Group Deployment. This functionality provides a way to narrow down the potential cause of latency in an Availability Group deployment.
How does it Work?
As seen below, the Availability Group Latency Data Collection functionality can be accessed from the Availability Group Dashboard.


