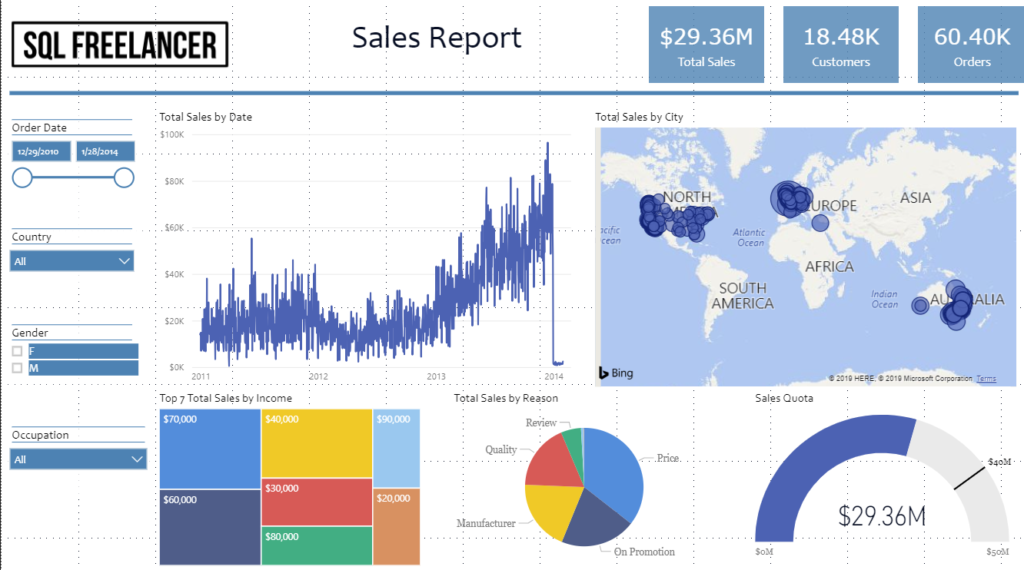
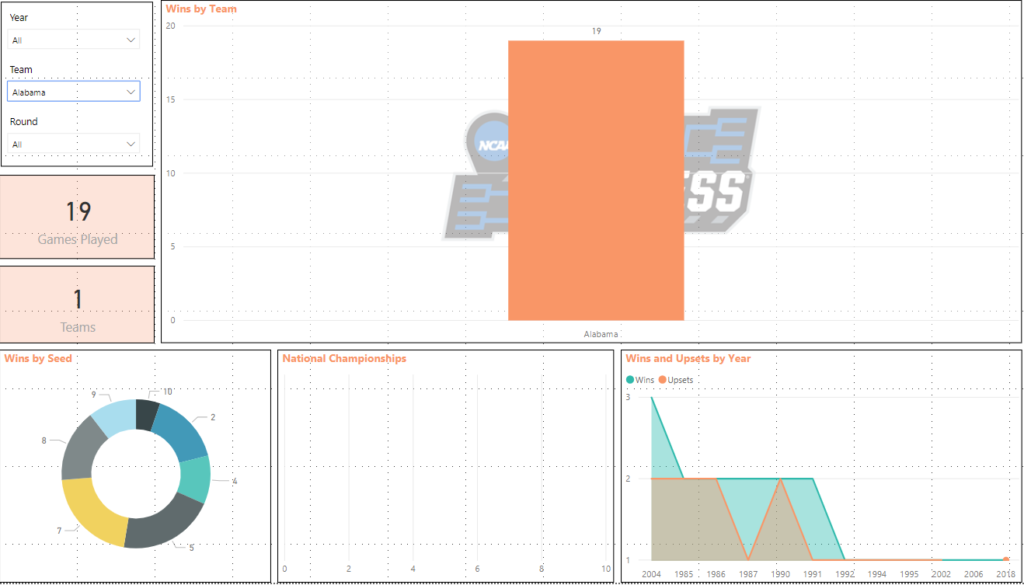
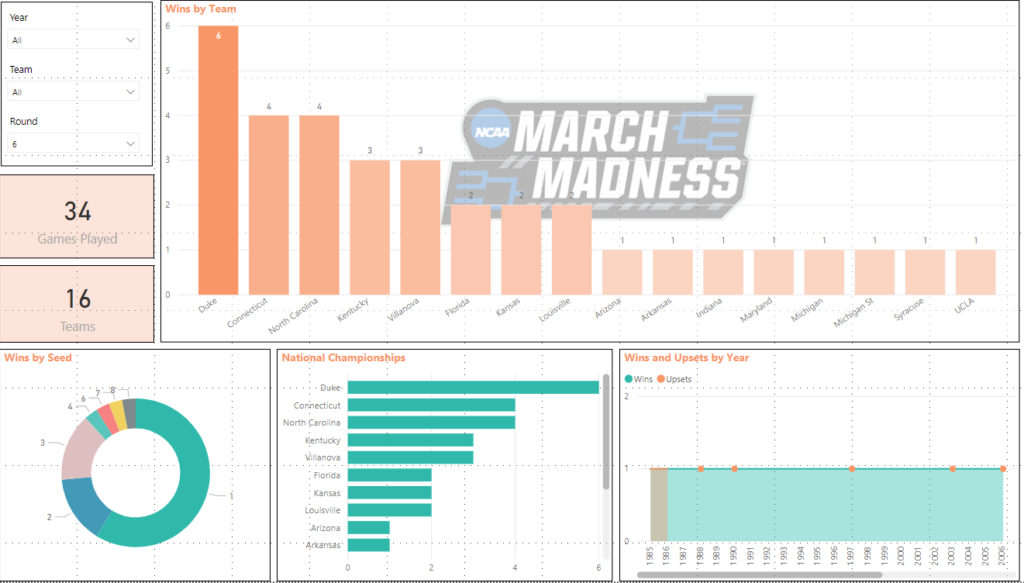
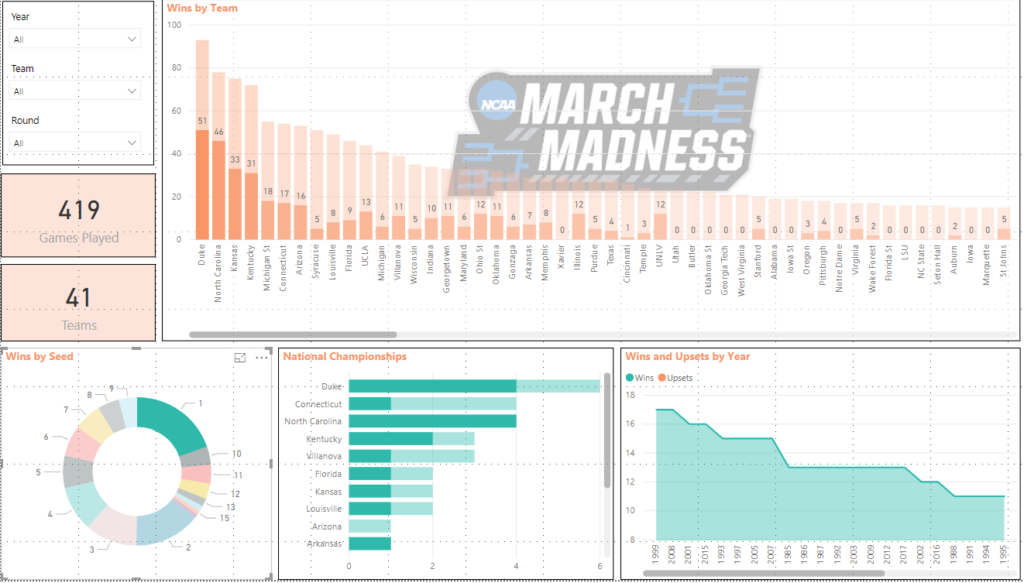
Using bookmarks in Power BI help you capture the currently configured view of a report page, including filtering and the state of visuals, and later let you go back to that state by simply selecting the saved bookmark.
You can also create a collection of bookmarks, arrange them in the order you want, and subsequently step through each bookmark in a presentation to highlight a series of insights, or the story you want to tell with your visuals and reports.
In this post we’ll quickly go over how to create a few bookmarks and view them as a slideshow if you will.
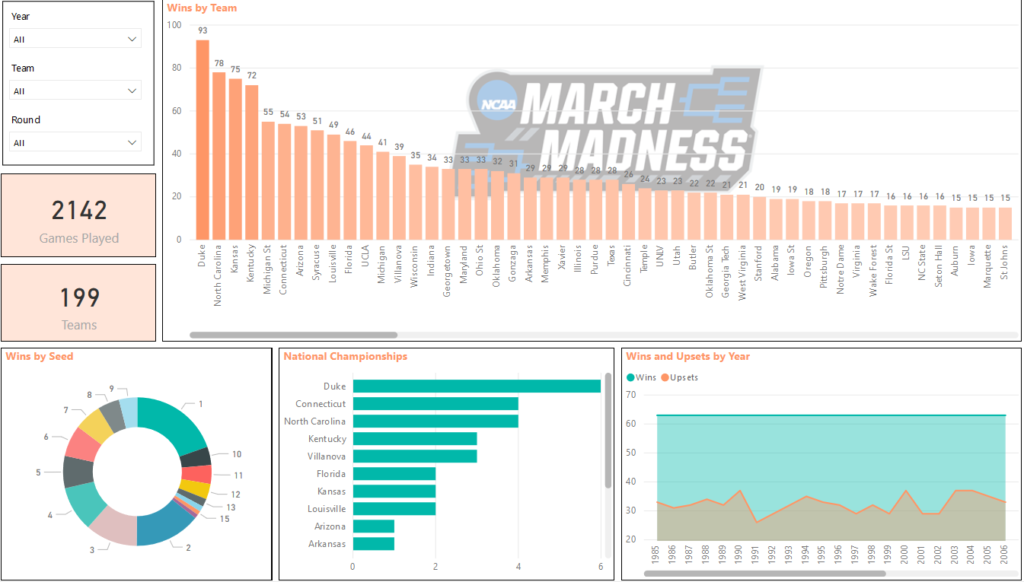
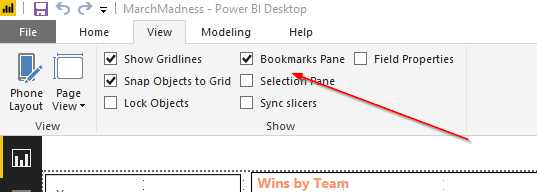
I’m going to use my March Madness Report I created in an earlier post. Once my report is opened in Power BI Desktop, I’m going to click on the View tab in the ribbon and select “Bookmarks Pane”
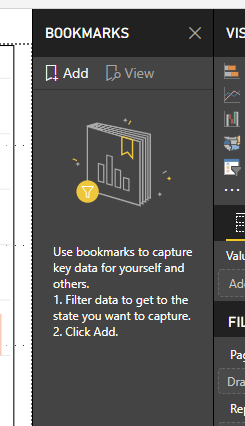
This should bring up a new Bookmarks pane inside PBI Desktop:
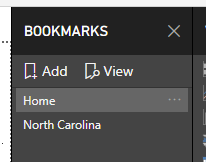
Remember, bookmarks are used to capture the current view of the report so I’m going to use the default view where I’m showing all data and I’m going to name the bookmark “Home”. Make sure all filters are selected to show all data and click Add under the bookmark pane. This will create a new Bookmark, named Bookmark 1. Click the ellipsis and select rename to rename the bookmark appropriately.
Next, I like North Carolina, so I’m going to go to my Team Filter and choose North Carolina which will show me data for only this team.
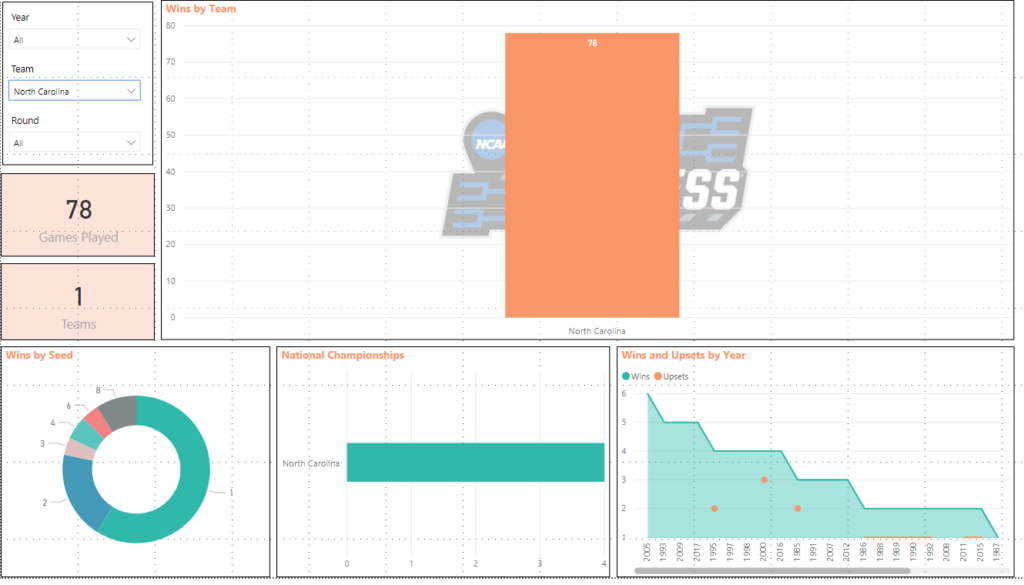
In my bookmark pane, I’m going to click Add again and rename to North Carolina.
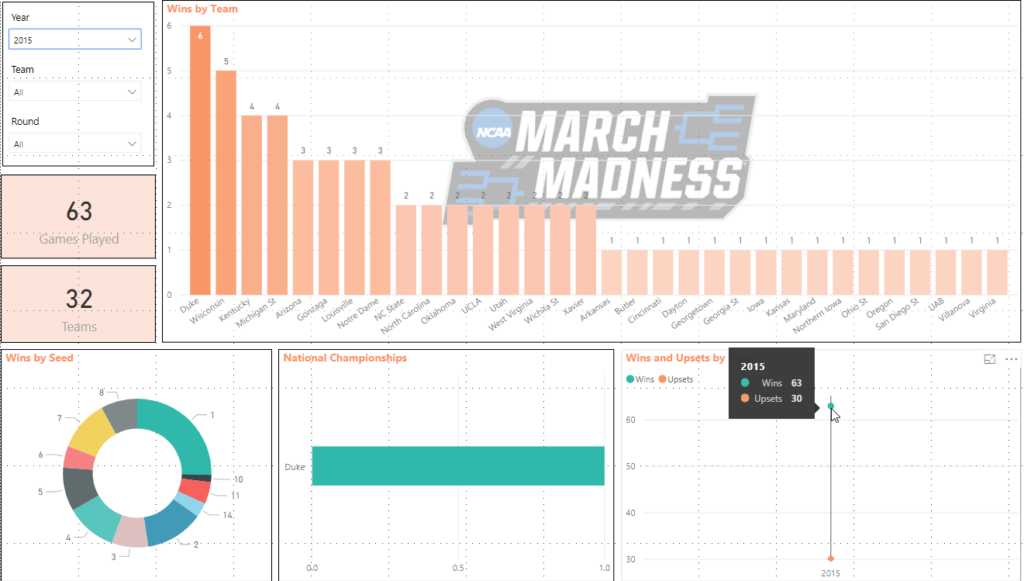
Next, I want to view data on North Carolina from 2000 to present so I’ll change the Year Filter.
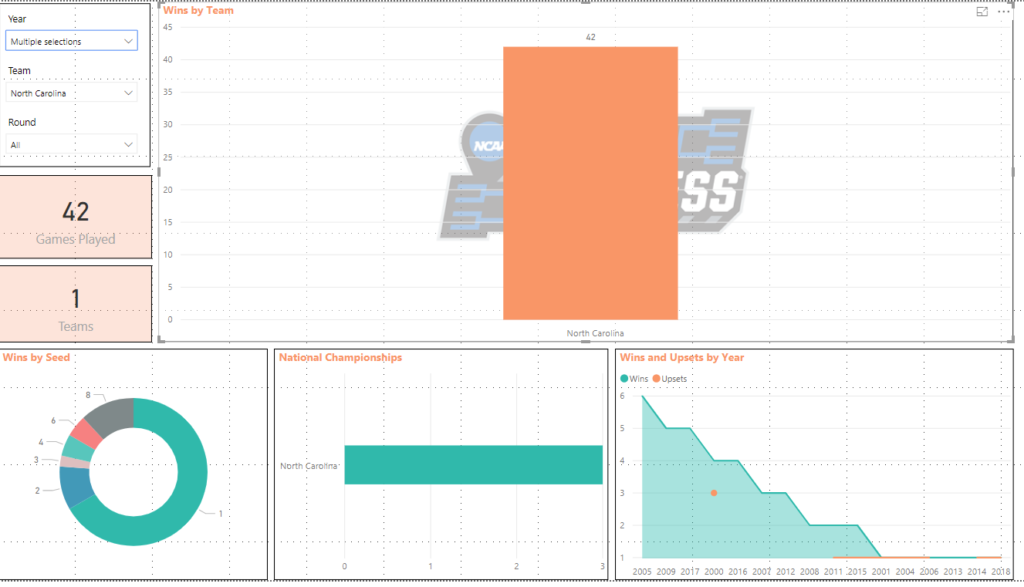
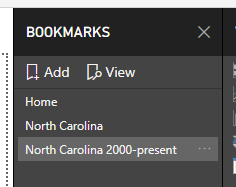
In my bookmark pane, I’m going to click Add again and rename to North Carolina 2000-present.
Now, if I click on any of bookmarks, it will take me to the data that was saved for each. This is a great way to present data in a meeting/conference so you don’t have to manually change the filters during the engagement.
We can also click the View button in the Bookmark pane to view a slideshow using the arrows at the bottom to navigate:


