Performance Tuning Series – Storage Optimization: Maximizing Disk Performance

Efficient storage management is critical for SQL Server performance, as disk I/O is often the slowest component in the entire system. Poor disk performance can cause bottlenecks, leading to slow query response times and general system sluggishness. Optimizing storage involves using the right hardware, configuring SQL Server for optimal use of that hardware, and regularly maintaining the data stored on disk.

Understanding the Role of Disk I/O in SQL Server

SQL Server heavily relies on disk I/O to store and retrieve data. Every query that retrieves data from a table, reads or writes logs, or handles tempdb operations, interacts with the disk. Efficient storage optimization can drastically reduce I/O latency and increase throughput, leading to faster query execution times. Key areas where disk I/O impacts performance include:

  • Data and Index Pages: Stored on disk and loaded into memory when queried.
  • Transaction Logs: Sequential writes to disk that track all database modifications.
  • Tempdb: A shared workspace for temporary data storage, often involving frequent disk I/O.
  • Backups and Restores: Operations that require significant disk activity.

To minimize the impact of disk I/O on performance, several best practices can help ensure SQL Server maximizes its disk performance.

Best Practices for SQL Server Storage Optimization

1. Use High-Performance Storage Solutions

The type of storage you choose for SQL Server has a significant impact on overall performance. Mechanical hard drives (HDDs) are slow and can cause performance bottlenecks, especially in high-transactional environments. Instead, use the following types of storage for better performance:

  • Solid-State Drives (SSDs): SSDs offer faster read/write speeds compared to traditional spinning disks (HDDs). SSDs reduce the time it takes to retrieve data from disk, making them ideal for SQL Server databases that require low-latency access.
    • Best Practice: Use SSDs for your data, log files, and tempdb. This will drastically reduce I/O wait times, leading to faster query response times.
  • NVMe Drives: NVMe (Non-Volatile Memory Express) drives provide even better performance than SSDs by using a direct connection to the CPU, bypassing the traditional SATA interface. NVMe drives can offer lower latency and higher throughput, making them ideal for databases with high I/O demands.
    • Best Practice: For mission-critical databases that handle large volumes of transactions or queries, consider using NVMe drives for primary storage.
  • SAN (Storage Area Network): For larger environments, a SAN can offer centralized, high-speed storage. Ensure that your SAN is properly configured to handle the database workload, with enough bandwidth and redundancy to avoid bottlenecks.
2. Separate Data, Log, and Tempdb Files

SQL Server performs different types of I/O operations on its data, transaction log, and tempdb files, and these should be managed separately for optimal performance:

  • Data Files (MDF/NDF): These files handle random I/O as SQL Server reads and writes data across different parts of the database.
  • Transaction Logs (LDF): Transaction logs are written sequentially, and disk I/O is generally sequential. Transaction logs require high write performance to ensure efficient logging and recovery.
  • Tempdb Files: Tempdb handles temporary objects and query operations, and it often experiences high I/O. High activity in tempdb can lead to contention and performance degradation.

Best Practice: Place data, log, and tempdb files on separate physical drives or storage volumes to prevent I/O contention. This ensures that heavy I/O on one file type (such as a data read) does not slow down other critical operations like logging or tempdb transactions.

3. Optimize I/O Through Disk Striping (RAID)

Redundant Array of Independent Disks (RAID) is a technology used to improve disk performance and redundancy by distributing data across multiple drives. Different RAID levels provide varying balances of performance, redundancy, and cost.

  • RAID 1 (Mirroring): Provides redundancy by duplicating data across two drives. It offers fault tolerance but no performance benefits.
  • RAID 5 (Striping with Parity): Distributes data across several disks, with parity for fault tolerance. RAID 5 improves read performance but may suffer from slow write performance due to the overhead of parity calculations.
  • RAID 10 (Mirroring and Striping): Combines RAID 1 and RAID 0 to provide both redundancy and performance. RAID 10 offers faster read/write speeds and is ideal for high-performance SQL Server environments, although it requires more drives and is costlier.

Best Practice: For SQL Server, RAID 10 is often recommended for data files due to its balance of performance and fault tolerance. Transaction logs benefit from RAID 1, as sequential writes don’t require the parity overhead of RAID 5.

4. Optimize Tempdb Performance

Tempdb is a shared system database that handles temporary data, intermediate results for queries, and row versioning. It can become a significant performance bottleneck, especially in high-concurrency environments.

  • Best Practice: To optimize tempdb:
    • Use multiple tempdb files: SQL Server allows you to configure multiple tempdb data files to reduce contention and improve throughput. Ideally, you should have one tempdb file per logical CPU core (up to 8 cores).
    • Place tempdb on fast storage: Since tempdb is highly I/O-intensive, place it on the fastest storage available (preferably SSD or NVMe).
    • Monitor tempdb usage: Regularly monitor tempdb for signs of contention (such as high waits on PFS, GAM, or SGAM pages). This can indicate the need for additional tempdb files or further optimization.

5. Monitor Disk I/O Performance

Regularly monitoring disk performance is essential to identify and address bottlenecks before they affect SQL Server. You can use SQL Server’s built-in tools and OS-level monitoring tools to track I/O performance.

  • Best Practice: Monitor the following key metrics:
    • Disk Latency: Track disk latency (measured in milliseconds). Ideally, disk read/write latency should be under 10ms for SSDs and under 1ms for NVMe drives. High latency indicates storage performance issues.
    • Disk Queue Length: This metric shows how many requests are waiting to be processed by the disk. Long disk queues indicate that SQL Server is overloading the storage subsystem.
    • Read/Write IOPS: Input/output operations per second (IOPS) provide a measure of how efficiently your storage can handle the database’s read/write workload. Compare actual IOPS with the capacity of your storage hardware to ensure it meets the demand.
  • Tools for Monitoring:
    • SQL Server Performance Monitor (PerfMon): Tracks disk performance counters like Avg. Disk sec/Read and Avg. Disk sec/Write, providing insight into disk latency.
    • SQL Server Dynamic Management Views (DMVs): DMVs like sys.dm_io_virtual_file_stats offer real-time insights into SQL Server disk I/O activity at the database and file level.

6. Enable Data Compression

SQL Server offers data compression features that can reduce the size of data stored on disk, leading to lower storage requirements and potentially improved performance by reducing I/O.

  • Best Practice: Consider enabling row-level or page-level compression on tables that experience heavy read activity. Compression reduces the number of data pages SQL Server has to read from disk, decreasing I/O and improving query performance.
    • Row-Level Compression: Minimizes the storage footprint of individual rows without adding significant CPU overhead.
    • Page-Level Compression: Compresses data at the page level, providing greater space savings, but requires more CPU resources.

Regularly review data access patterns to determine which tables or indexes would benefit most from compression, particularly in environments with large datasets and frequent queries.

7. Regular Index Maintenance

Fragmented indexes can cause SQL Server to perform extra I/O when retrieving data, leading to performance issues. Regular index maintenance ensures that SQL Server performs efficiently.

  • Best Practice: Rebuild or reorganize fragmented indexes periodically to optimize disk usage and reduce unnecessary I/O.
    • Use index rebuilds for heavily fragmented indexes (over 30% fragmentation) to completely rebuild the index structure.
    • Use index reorganization for moderately fragmented indexes (10-30% fragmentation) to re-sort data pages without fully rebuilding the index.

Automate index maintenance tasks to ensure they are regularly performed without manual intervention.

Conclusion

Storage optimization is key to achieving high performance in SQL Server environments. By using the right storage hardware, segregating data, log, and tempdb files, utilizing RAID configurations, and regularly monitoring disk performance, you can minimize I/O bottlenecks and ensure your SQL Server operates efficiently. When combined with regular index maintenance, compression, and proper tempdb management, a well-optimized storage system forms the foundation of a performant SQL Server instance.

Introducing database watcher for Azure SQL

Reliable, in-depth, and at-scale monitoring of database performance has been a long-standing top priority for SQL customers. Today, we are pleased to announce the public preview of database watcher for Azure SQL, a managed database monitoring solution to help our customers use Azure SQL reliably and efficiently.


Managed monitoring for Azure SQL

To enable database watcher, you do not need to deploy any monitoring infrastructure or install and maintain any monitoring agents. You can create a new watcher and start monitoring your Azure SQL estate in minutes.


Once enabled, database watcher collects detailed monitoring data from your databases, elastic pools, and managed instances into a central data store in your Azure subscription. Data is collected with minimal latency – when you open a monitoring dashboard, you see database state as of just a few seconds ago.

Read more here…

SQL Server Performance Dashboard Reports

SQL Server 2012 Performance Dashboard Reports is one of most popular SQL Server monitoring solution for customers and SQL community leveraging dynamic management views (DMVs) for monitoring and reporting and available at no cost to consumers. SQL Server Performance Dashboard Reports are available as a set of custom reports in SQL Server Management Studio (SSMS) which runs against the connected instance in Object Explorer. When monitoring large enterprise deployments of SQL Server, hosting SQL Server Performance Dashboard Reports on a central reporting server can provide additional benefits making life easier for enterprise DBAs for monitoring and troubleshooting SQL Server issues. To support hosting SQL performance dashboard reports on a central SQL Server Reporting Services instance, we have customized SQL Server 2012 Performance Dashboard Reports, added new reports and uploaded in Tiger toobox github repository for customers and SQL community. The reports are tested to run against SQL Server 2012, SQL Server 2014 and SQL Server 2016 versions of target SQL Server instance and can be deployed against SQL Server 2012, SQL Server 2014 or SQL Server 2016 Reporting Services instance.

Following are some of the benefits of hosting SQL Performance dashboard reports on central SSRS reporting server.

  • Monitoring Reports accessible anytime, anywhere using browser – This removes the dependency of thick client like SQL Server Management Studio (SSMS) to be present on the workstation server allowing DBAs, DevOps audience to check the health of SQL Server and resource consumption using web browser from any workstation machine with access to the server.
  • Scheduling automatic report delivery – SSRS allows scheduled email or file share delivery of reports. This allows DBAs, application owners and database stakeholders to choose push model where by performance health reports can be scheduled to run against specified SQL Server instances at the specified time and be delivered in their mailbox to proactively monitor overall health of SQL Server instance and detect any anomaly.
  • Performance Base lining using Report Snapshots – SSRS allows you to capture scheduled point in time report snapshots at the specified time interval allowing DBAs to establish performance baselines using historical snapshots for the target SQL Server instances.
  • Linked Reports for Application owners and other stakeholders – In an enterprise environment, most application teams and stakeholders are interested to see the performance, resource consumption, blocking information and overall health of their SQL Server instance on-demand. In such scenarios, DBAs can create linked reports for the target SQL Server instances on the SSRS central server and delegate them permissions to view reports for their target SQL Server instance of interest. This allows application teams, developers to be self-sufficient to check the overall health of their SQL Server instances creating some bandwidth for DBAs who needs to be contacted only if there is an anomaly or problem detected.

Click here to view the rest of this post.

Capturing Deadlocks with Extended Events

I’ve been noticing a lot of deadlocks on my server. What’s the best way to track down the queries so I can fix the problem?

There are a few different ways that you can capture deadlock information. You can setup a trace flag (1222) to write the deadlock information to the error log, setup a Profiler trace to capture the deadlock graph, or setup an Extended Event to capture all sorts of information.

I’m going to focus on setting up an Extended Event in this post since MS continues to say Profiler will not be released in future versions. Extended Events are the future so why not start using them now?

In SSMS, drill down to Management, Extended Events. Right click on Sessions and click New Session Wizard:

Deadlocks with Extended Events 1

Click next on the Introduction screen and give the Session a name. I’m going to name this session Deadlocks:

Deadlocks with Extended Events 2

Click next. On the Choose Template screen you can choose a predefined template (like Profiler) or you can create your own events by choosing “Do not use a template”. For this post, let’s create our own:

Deadlocks with Extended Events 3

Click next and you’ll see hundreds of events (like Profiler). We only want to capture deadlock data so let’s scroll down to the very bottom and choose xml_deadlock_report. Click on the event and click the right arrow to move it into the Selected Events box:

Deadlocks with Extended Events 4

You can choose other events if needed, but for the simplicity of this post I’m just going to use this one. Click next. The Capture Global Fields page allows us to select what fields we want to capture. These are unique to each event selected. For this example, I’ll choose the following fields:

  • Callstack
  • Client_app_name
  • Client_hostname
  • Database_id
  • Database_name
  • Plan_handle
  • Process_id
  • Sql_text
  • Transaction_id
  • Transaction_sequence

Deadlocks with Extended Events 5

Click next. On this page you can apply filters if needed. I’ll setup a filter so that I only capture data from the RollTide database. There are hundreds of different filters that can be configured so that you don’t pull back data that is not needed:

Deadlocks with Extended Events 6

Click next to the Session Data Storage page. This page allows you to save data to a file or work with only the most recent data. I don’t want to keep thousands upon thousands of events so I’ll choose “Work with only the most recent data”

Deadlocks with Extended Events 7

The next page summarizes all the options we have selected. You can also script this session if you need to create it on other servers or save it for later. Click Finish to create the new session.

The last page allows you to start the session immediately and watch live data. For this post, I’ll choose both:

Deadlocks with Extended Events 8

You should see the new session under Extended Events and the Live Data tab should appear:

Deadlocks with Extended Events 9

Deadlocks with Extended Events 10

Once a deadlock occurs it should show the deadlock in the Live Data window:

Deadlocks with Extended Events 11

This view shows all of the fields we selected including the XML report. If you click on the Deadlock tab, you’ll see the graph:

Deadlocks with Extended Events 12

You can also use this query to see detailed information including the Deadlock graph and Event XML

SELECT
DATEADD(mi, DATEDIFF(mi, GETUTCDATE(), CURRENT_TIMESTAMP), DeadlockEventXML.value('(event/@timestamp)[1]', 'datetime2')) AS [EventTime],
DeadlockEventXML.value('(//process[@id[//victim-list/victimProcess[1]/@id]]/@hostname)[1]', 'nvarchar(max)') AS HostName,
DeadlockEventXML.value('(//process[@id[//victim-list/victimProcess[1]/@id]]/@clientapp)[1]', 'nvarchar(max)') AS ClientApp,
DB_NAME(DeadlockEventXML.value('(//process[@id[//victim-list/victimProcess[1]/@id]]/@currentdb)[1]', 'nvarchar(max)')) AS [DatabaseName],
DeadlockEventXML.value('(//process[@id[//victim-list/victimProcess[1]/@id]]/@transactionname)[1]', 'nvarchar(max)') AS VictimTransactionName,
DeadlockEventXML.value('(//process[@id[//victim-list/victimProcess[1]/@id]]/@isolationlevel)[1]', 'nvarchar(max)') AS IsolationLevel,
DeadlockEventXML.query('(event/data[@name="xml_report"]/value/deadlock)[1]') AS DeadLockGraph,
DeadlockEventXML
FROM
(
SELECT
XEvent.query('.') AS DeadlockEventXML,
Data.TargetData
FROM
(
SELECT
CAST(target_data AS XML) AS TargetData
FROM sys.dm_xe_session_targets st
JOIN sys.dm_xe_sessions s ON s.address = st.event_session_address
WHERE s.name = 'Deadlocks' AND
st.target_name = 'ring_buffer'
) AS Data
CROSS APPLY TargetData.nodes('RingBufferTarget/event[@name="xml_deadlock_report"]') AS XEventData(XEvent)
) AS DeadlockInfo 

Managing the size of the SQL Server SSIS catalog database

The SSIS catalog is the central point for working with Integration Services (SSIS) projects that you’ve deployed to the SSIS server. When the SSIS catalog is implemented, the SSISDB database is automatically created. The scope of this post will focus on the SSISDB growth more than the SSIS catalog itself.

SSIS projects, packages, parameters, environments, and operational history are all stored in the SSISDB database so if you have hundreds of SSIS packages or packages that run every few minutes you could see how the database storing all the historical information would grow exponentially.

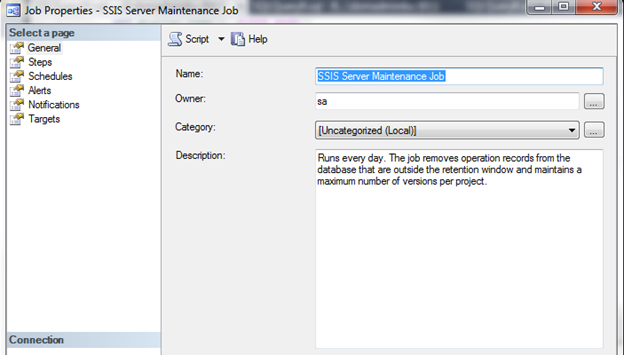
Also included when you enable this feature is a SQL Server Agent Job called SSIS Server Maintenance job:

SQL Freelancer SSIS Catalog 1
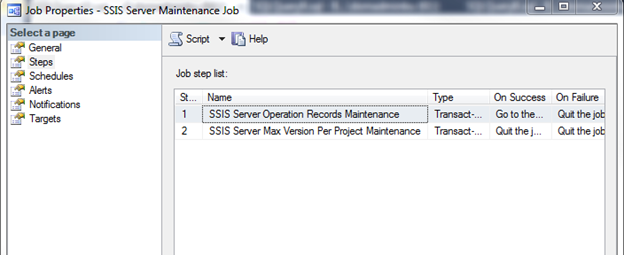
Inside this job are two steps, SSIS Server Operation Records Maintenance and SSIS Server Max Version Per Project Maintenance, that will help clean up the database. By default, this job is set to run at 12:00am nightly which is sufficient:

SQL Freelancer SSIS Catalog
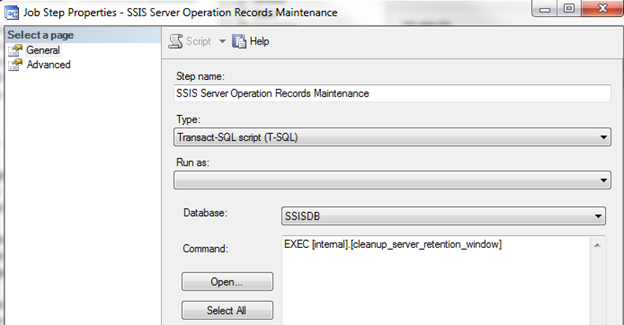
Looking at the first step, SSIS Server Operations Records Maintenance, you will notice that it executes a stored procedure named internal.cleanup_server_retention_window. This sounds like it could be the stored procedure that cleans up history:

SQL Freelancer SSIS Catalog
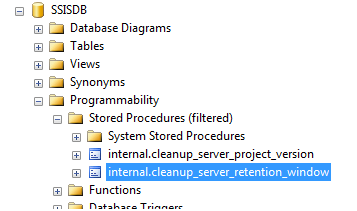
Let’s browse out to the stored procedure in Management Studio and take a look at the code:

SQL Freelancer SSIS Catalog
You can see from the very beginning of the stored procedure in the BEGIN TRY statement it first looks to see if Operation cleanup is enabled and if cleanup is enabled then it looks for the Retention Window:

SQL Freelancer SSIS Catalog
Click here to view the rest of this post.

Identify SQL Server databases that are no longer in use

I have come across this problem a few different times in my career. I’ll change jobs and they’ll be numerous database servers that I inherit that I know nothing about. It’s a process to learn what each server does, what applications use them, and what databases are no longer used and can be removed.

There is no “tried and true” method to knowing if a database is truly no longer used, but I have three different suggestions that may help with your research. These suggestions are all based around capturing user connections.

SQL Server User Connection Count

One suggestion to finding orphan databases is to get connection counts. In most cases, if a database has zero user connections over a long period of time, it may be time to look into removing this database. The following query will capture server name, database name, number of connections, and time the query was executed and it will also filter out system databases because they are needed:

SELECT @@ServerName AS server
 ,NAME AS dbname
 ,COUNT(STATUS) AS number_of_connections
 ,GETDATE() AS timestamp
FROM sys.databases sd
LEFT JOIN sysprocesses sp ON sd.database_id = sp.dbid
WHERE database_id NOT BETWEEN 1 AND 4
GROUP BY NAME

SQL Freelancer SQL Server Database Connections

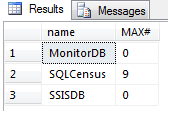
I’m using a server named BUADMIN for this example. As you can see I have 3 active connections to the database SQLCensus. This is a good indication that this database is in use. MonitorDB and SSISDB have 0 connections, so I may need to monitor them further. The easiest way to monitor these databases is to create a stored procedure using this query so I can schedule it. You can also put this query directly into a SQL Server Agent Job and set a schedule.

Before setting a schedule, you will need to create a table that will hold the results. To create a table using the following code:

SET ANSI_NULLS ON
GO
SET QUOTED_IDENTIFIER ON
GO
CREATE TABLE [dbo].[Connections](
 [server] [nvarchar](130) NOT NULL,
 [name] [nvarchar](130) NOT NULL,
 [number_of_connections] [int] NOT NULL,
 [timestamp] [datetime] NOT NULL
) ON [PRIMARY]
GO

Next, create a stored procedure that will INSERT the results into the table:

SET ANSI_NULLS ON
GO
SET QUOTED_IDENTIFIER ON
GO
CREATE PROCEDURE usp_ConnectionsCount 
AS
BEGIN
 SET NOCOUNT ON;
INSERT INTO Connections 
  SELECT @@ServerName AS server
 ,NAME AS dbname
 ,COUNT(STATUS) AS number_of_connections
 ,GETDATE() AS timestamp
FROM sys.databases sd
LEFT JOIN master.dbo.sysprocesses sp ON sd.database_id = sp.dbid
WHERE database_id NOT BETWEEN 1
  AND 4
GROUP BY NAME
END

Once the stored procedure is created you can create a SQL Server Agent Job and set it to run on a schedule. I’ll set it to run every 10 minutes.

Let this run a few days, a few months or however long you think is appropriate and then go back and examine the results. Once you are happy with the timeframe chosen, use the following query to select the MAX number of connections per database:

SELECT NAME
 ,MAX(number_of_connections) AS MAX#
FROM Connections
GROUP BY NAME

SQL Freelancer SQL Server Database Connections

From here you will be able to determine if any databases have not had a user connection in the timeframe specified.

Detailed SQL Server Connection Information

The above suggestion is good if you just need connection counts. However, sometimes a count isn’t good enough. Sometimes you need to know exactly what is connecting. This suggestion helps in that aspect.

It’s basically setup the same way, create a stored procedure, insert data into a table, set a schedule and examine the results.

The following query gives you more information:

SELECT @@ServerName AS SERVER
 ,NAME
 ,login_time
 ,last_batch
 ,getdate() AS DATE
 ,STATUS
 ,hostname
 ,program_name
 ,nt_username
 ,loginame
FROM sys.databases d
LEFT JOIN sysprocesses sp ON d.database_id = sp.dbid
WHERE database_id NOT BETWEEN 0
  AND 4
 AND loginame IS NOT NULL

SQL Freelancer SQL Server Database Connections
Click here to view the rest of this post.

Collect SQL Server Performance Counters and Build Reports with SSRS

Third party tools are awesome for capturing performance metrics, but some small shops (and even large shops) don’t budget for this type of software leaving it up to the DBA to create their own monitoring solution.

There are a few different ways to capture certain performance metrics, but in this post I’ll focus on using the sys.dm_os_performance_counters DMV and how to view this data in a more readable form using SQL Server Reporting Services graphs. The DMV doesn’t include all the counters as Performance Monitor, but it does show the SQL Server related counters. (Note that some of the counters in this DMV are of cumulative values since the last reboot.)

You can query this DMV using the following query:

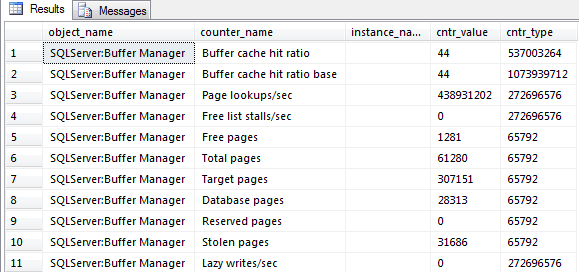
SELECT * FROM sys.dm_os_performance_counters

SQL Freelancer SQL Server Performance Counters SSRS

As you can see from the screenshot above, this can be hard to read. Also, it only shows the current values at the time the query is executed so you don’t know anything about the past and it makes it hard to see how the data fluctuates during the business day.

Collecting the SQL Server Monitoring Report Data

For the purpose of simplicity, this tip will focus on one counter, Page Life Expectancy (PLE). I’ll show you how to capture data and create a graph for analysis.

First, we’ll need to create a table that will store our metrics:

CREATE TABLE [dbo].[CounterCollections](
[ID] [int] IDENTITY(1,1) NOT NULL,
[object_name] [varchar](128) NOT NULL,
[counter_name] [varchar](128) NOT NULL,
[cntr_value] [bigint] NOT NULL,
[collection_datetime] [datetime] NOT NULL )

Next, we’ll need to create a script that will insert our data into the table we created above:

INSERT INTO CounterCollections
SELECT object_name, counter_name, cntr_value, GETDATE() collection_datetime
FROM sys.dm_os_performance_counters
WHERE object_name = ‘SQLServer:Buffer Manager’
AND counter_name = ‘Page life expectancy’

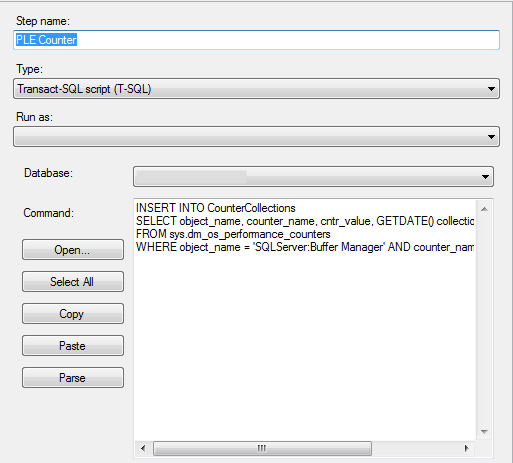
Finally, we’ll need to create a SQL Server Agent Job that will run the script above on a specified schedule:

SQL Freelancer SQL Server Performance Counters SSRS
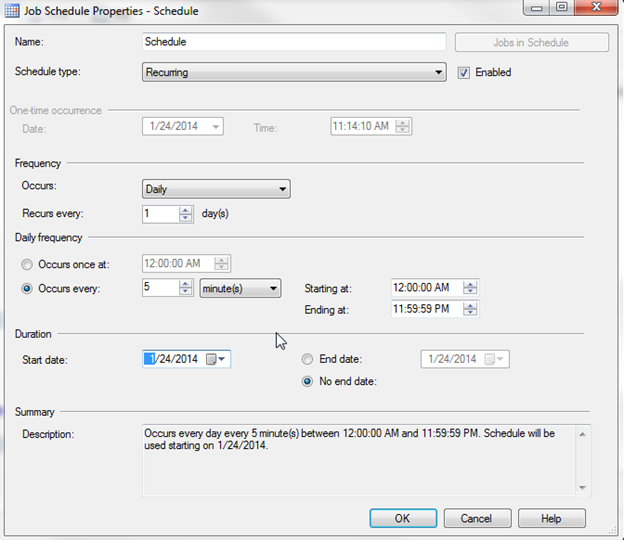
I’ll run this job every 5 minutes:

SQL Freelancer SQL Server Performance Counters SSRS

Creating the SQL Server Monitoring Report

While the table gathers data we can switch over to Business Intelligence Development Studio (BIDS) or the SQL Server Data Tools (SSDT) and create a SSRS Report that will display our data.

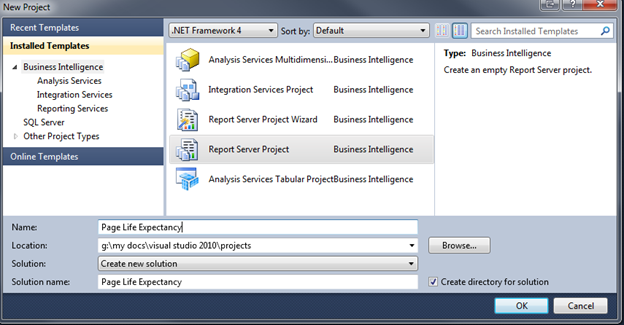
In this example, I’m using SSDT. Choose File, New Project. On the New Project dialog choose Report Server Project and name the Project:

SQL Freelancer SQL Server Performance Counters SSRS
Click here to view the rest of this post.

Fixing SQL Server error in-row data RSVD page count is incorrect

I ran DBCC CHECKDB (Integrity Checks) in my maintenance plan and I also ran it manually, but I keep getting the error “The In-row data RSVD page count for object “table_name” , index ID 0, partition ID 58037252456448, alloc unit ID 58037252456448 (type In-row data) is incorrect.” How can I fix this error?

Solution

Before we discuss the simple steps to fixing this error, let’s discuss what might have happened in this situation.

Anytime you see an integrity check error it might make you a little queasy. No need to worry on this error. If you have recently upgraded from SQL Server 2000 then this error is somewhat common. I know what you’re saying, “Why is there a tip regarding SQL Server 2000?” Trust me, a lot of people are still running SQL Server 2000 which is now out of compliance with Microsoft, so everyone is in a rush to upgrade. Anyway, SQL Server 2000 used to update the page space used metadata. Once SQL Server 2005 came along, this was no longer the case so if you didn’t run DBCC UPDATEUSAGE after the upgrade/migration this error is likely to appear when you run DBCC CHECKDB.

Here is what the error message looks like:

Msg 2508, Level 16, State 3, Line 1

The In-row data RSVD page count for object "table_name", index ID 0, partition ID 58037252456448,
alloc unit ID 58037252456448 (type In-row data) is incorrect. Run DBCC UPDATEUSAGE.

Running DBCC UPDATEUSAGE

If you notice in the maintenance plan or the DBCC CHECKDB results above, it displays “Run DBCC UPDATEUSAGE” after the error message. Ta da! After backing up your databases and establishing a maintenance window run DBCC UPDATEUSAGE (databasename). In a perfect world, SQL would notice this error and run DBCC UPDATEUSAGE on the appropriate table. This is not a perfect world, so we have to run it manually.

DBCC UPDATEUSAGE reports and corrects pages and row count inaccuracies in the catalog views. These inaccuracies may cause incorrect space usage reports returned by the sp_spaceused system stored procedure – MSDN.

 DBCC UPDATEUSAGE (Apollo32_Fixed)

After running DBCC UPDATEUSAGE (databasename) on my questionable database you can see that all the page counts have been updated:


DBCC UPDATEUSAGE: Usage counts updated for table 'UserList' (index 'UserList', partition 1):
        USED pages (In-row Data): changed from (5) to (4) pages.
DBCC UPDATEUSAGE: Usage counts updated for table 'UserRights' (index 'UserRights', partition 1):
        USED pages (In-row Data): changed from (72) to (24) pages.
        RSVD pages (In-row Data): changed from (80) to (33) pages.
DBCC UPDATEUSAGE: Usage counts updated for table 'UserRights' (index 'UserRights', partition 1):
        USED pages (In-row Data): changed from (5) to (4) pages.
DBCC UPDATEUSAGE: Usage counts updated for table 'UserGroups' (index 'UserGroups', partition 1):
        USED pages (In-row Data): changed from (4) to (3) pages.
DBCC UPDATEUSAGE: Usage counts updated for table 'Application' (index 'Application', partition 1):
        USED pages (In-row Data): changed from (3) to (2) pages.
        

You only need to run DBCC UPDATEUSAGE once. After the page counts have been corrected your SQL Server will be back to normal. If you do not fix this issue right away, page counts will continue to get worse when data is added and will result in abnormalities in space usage reports.

After the update, running DBCC CHECKDB gives me a clean database again:

CHECKDB found 0 allocation errors and 0 consistency errors in database ”database_name’. DBCC execution completed. If DBCC printed error messages, contact your system administrator.

In essence, DBCC UPDATEUSAGE updates the used, reserved, and rows columns of the sysindexes (later named sys.indexes in SQL Server 2005) table.

In this example I have two databases named Apollo32 and Apollo32_Fixed. When running an integrity check against Apollo32 I get the error described above. Apollo32_Fixed is a copy of Apollo32 after running DBCC UPDATEUSAGE.

Before and After Comparison

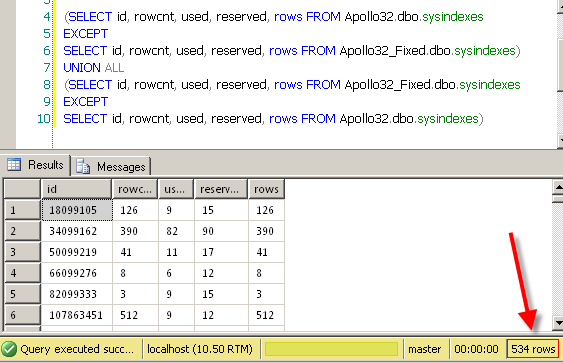
If I compare Apollo32.dbo.sysindexes to Apollo32_Fixed.dbo.sysindexes I can see I have 534 differences.

 (SELECT id, rowcnt, used, reserved, rows FROM Apollo32.dbo.sysindexes
EXCEPT
SELECT id, rowcnt, used, reserved, rows FROM Apollo32_Fixed.dbo.sysindexes)
UNION ALL
(SELECT id, rowcnt, used, reserved, rows FROM Apollo32_Fixed.dbo.sysindexes
EXCEPT
SELECT id, rowcnt, used, reserved, rows FROM Apollo32.dbo.sysindexes)

SQL Freelancer SQL Server RSVD fix
Click here to view the rest of this post.

Using the SSIS WMI Task to Gather System Information

Finding server information is vital when monitoring servers and is usually pretty easy to find on SQL Servers, however when monitoring web or app servers this may be a bit of a challenge when SQL querying is not at your disposal. This post will talk about the SSIS task “WMI Data Reader” and how it can help you monitor your non-SQL Servers.

First, a short introduction to WMI….

WMI (Windows Management Instrumentation) is used for accessing management information in an enterprise environment. The ability to obtain management data from remote computers is what makes WMI useful. It provides a consistent approach to carrying out day-to-day management tasks with programming or scripting languages – MSDN

Some things you can do with WMI may include:

  • Rebooting a computer remotely
  • Get a list of applications installed on a local or remote computer
  • Find OS info such as the version of Windows and service pack levels
  • Query the event logs on a local or remote computer
  • Find system information such as Manufacturer and Model of a computer

As you can see, WMI is a very powerful tool and can be used locally or remotely.

There are tons of different metrics you can capture using WMI scripts, but for this example I’ll capture disk space information using the Win32_LogicalDisk class and insert it into a database table using a SSIS package.

First, let’s create our database table that will store our disk information:

CREATE TABLE DiskInfo
(
Drive varchar(4),
DriveSize numeric(18,2),
FreeSpace numeric(18,2),
[Date] Datetime Not NUll Default GetDate()
)

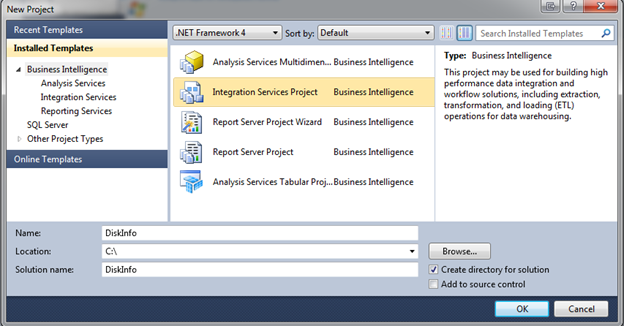
Once our table is created, we can create the SSIS package. Open BIDS or SSDT and create a new Integration Services project.

SQL Freelancer SQL Server SSIS WMI
From the SSIS toolbox, drag the WMI Data Reader Task into the Design view.

SQL Freelancer SQL Server SSIS WMI

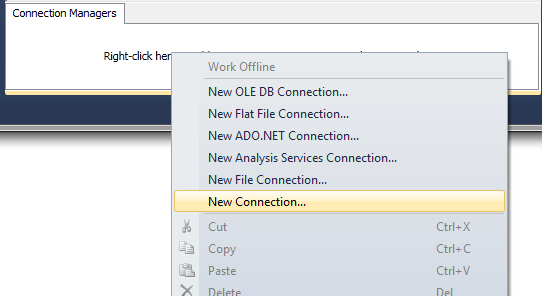
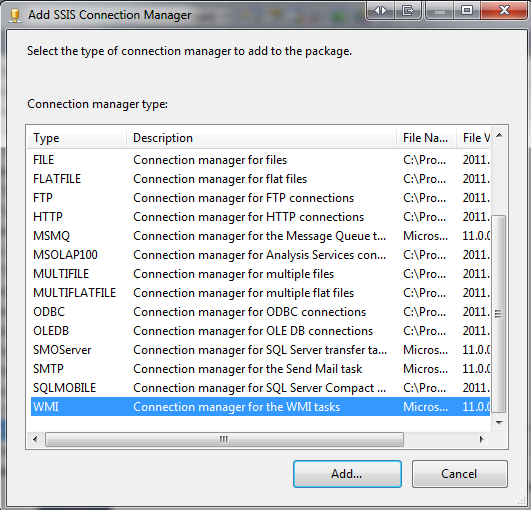
Right click in the Connection Manager window and select New Connection and select WMI. Click Add:

SQL Freelancer SQL Server SSIS WMISQL Freelancer SQL Server SSIS WMI
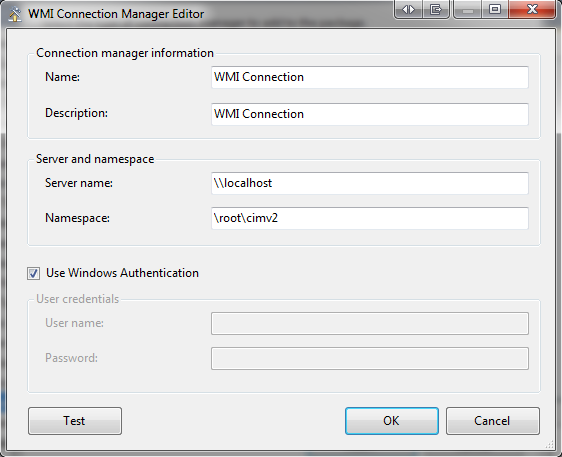
This will open the WMI Connection Manager Editor. Give the connection manager a name and description. If you are creating the package for a local computer then use \\localhost to connect. If you are creating the package for a remote server then use \\RemoteServer to connect. For this example, I’m connecting locally using Windows Authentication:

SQL Freelancer SQL Server SSIS WMI

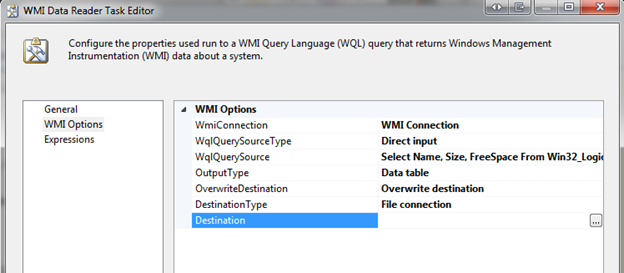
Next we’ll need to right click on the WMI Data Reader Task and choose edit. Click the WMI Options tab. This tab is where we will need to input information such as the WMI connection string and the WMI query. For this example, I have used the following:

  • WMI connection – This is the connection we created in the previous step.
  • WqlQuerySourceType – Direct input
  • WqlQuerySource – Select Name, Size, FreeSpace From Win32_LogicalDisk Where DriveType = 3
  • OutputType – Data table
  • OverwriteDestination – Overwrite destination
  • DestinationType – File connection
  • Destination – New destination (see below)

SQL Freelancer SQL Server SSIS WMI
Click here to view the rest of this post.

Detecting CPU Pressure

There are a few different ways to detect CPU pressure, for example, Performance Monitor or SQL Profiler, but in this tip we’ll discuss the wait type SOS_SCHEDULER_YIELD and the DMV sys.dm_os_schedulers.

Some of you might have seen the wait type SOS_SCHEDULER_YIELD and wondered what in the world is this? Books Online (BOL) describes this wait type as:

Occurs when a task voluntarily yields the scheduler for other tasks to execute. During this wait the task is waiting for its quantum to be renewed.

SOS_SCHEDULER_YIELD is a fairly common wait type and occurs when there is CPU pressure. SQL Server runs multiple threads and tries to allow all threads to run without problems. However, if all the threads are busy on each scheduler and can’t let other threads run, it will yield itself for another thread, which in turn creates the SOS_SCHEDULER_YIELD wait type.

You can see the top wait stats and the percentage of waits at the current point in time by running the following query by Tim Ford and Glenn Berry.

WITH Waits AS 
( 
SELECT 
wait_type, 
wait_time_ms / 1000. AS wait_time_s, 
100. * wait_time_ms / SUM(wait_time_ms) OVER() AS pct, 
ROW_NUMBER() OVER(ORDER BY wait_time_ms DESC) AS rn 
FROM sys.dm_os_wait_stats 
WHERE wait_type 
NOT IN 
('CLR_SEMAPHORE', 'LAZYWRITER_SLEEP', 'RESOURCE_QUEUE', 
'SLEEP_TASK', 'SLEEP_SYSTEMTASK', 'SQLTRACE_BUFFER_FLUSH', 'WAITFOR', 
'CLR_AUTO_EVENT', 'CLR_MANUAL_EVENT') 
) -- filter out additional irrelevant waits 
SELECT W1.wait_type, 
CAST(W1.wait_time_s AS DECIMAL(12, 2)) AS wait_time_s, 
CAST(W1.pct AS DECIMAL(12, 2)) AS pct, 
CAST(SUM(W2.pct) AS DECIMAL(12, 2)) AS running_pct 
FROM Waits AS W1 
INNER JOIN Waits AS W2 ON W2.rn <= W1.rn 
GROUP BY W1.rn, 
W1.wait_type, 
W1.wait_time_s, 
W1.pct 
HAVING SUM(W2.pct) - W1.pct < 95; -- percentage threshold;

After running this query on one of my servers I can see that only 2.22% of my waits are due to CPU pressure so I can rule that out as a cause for poor performance. (This is only current since the last SQL Service restart):

SQL Freelancer SQL Server CPU Pressure DMV

If you see a high percentage of this wait type then one way of troubleshooting this is to use the DMV sys.dm_os_schedulers. BOL describes sys.dm_os_schedulers as:

Returns one row per scheduler in SQL Server where each scheduler is mapped to an individual processor. Use this view to monitor the condition of a scheduler or to identify runaway tasks.

This DMV has several columns including number or workers, active tasks, and the status of each scheduler, etc., which can help troubleshoot certain problems, but the most important column is the one used for measuring queued tasks, the runnable_tasks_count column. This column displays the count of tasks yielding to other tasks resulting in a SOS_SCHEDULER_YIELD wait type. If this column is frequently greater than 0 then CPU pressure may be present and blocking may occur.

To see an average of current tasks and current waiting tasks you can use the following query:

SELECT AVG(current_tasks_count) AS [Avg Current Task], 
AVG(runnable_tasks_count) AS [Avg Wait Task]
FROM sys.dm_os_schedulers
WHERE scheduler_id < 255
AND status = 'VISIBLE ONLINE'

SQL Freelancer SQL Server CPU Pressure DMV
Click here to view the rest of this post.