Creating SQL Server performance based reports using Excel

I’m not a big fan of Performance Monitor but in this post we will review the steps in how to export the results so they can be read more easily in Excel.  This post will not discuss how to setup a data collector set and will assume the reader already has results saved to the file system in a .blg file format.

If you’ve ever used PerfMon you’ve probably noticed .blg files. These are the files that hold all of our performance data that we have collected over the past week. When you open this file in PerfMon it can be tedious work to get the data in a presentable form. Actually, I don’t know if there’s a good way to get this data in a presentable form using the PerfMon’s GUI.

SQL Freelancer SQL Server PeSQL Freelancer SQL Server Perfmon Graph Excel

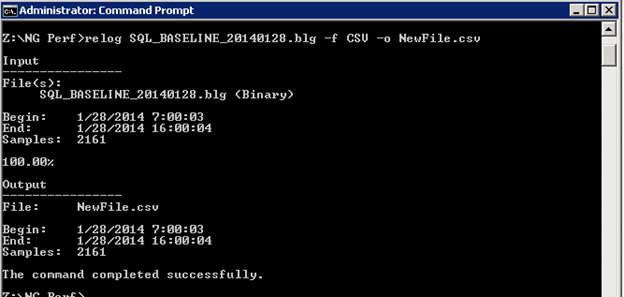
First thing we need to do is to convert the .blg to .csv so we can open it in Excel. To convert this file open command prompt and navigate to the directory the file is located and type:

Relog SQL_BASELINE_20140128.blg –f CSV –o NewFile.csv
SQL Freelancer SQL Server Perfmon Graph Excel
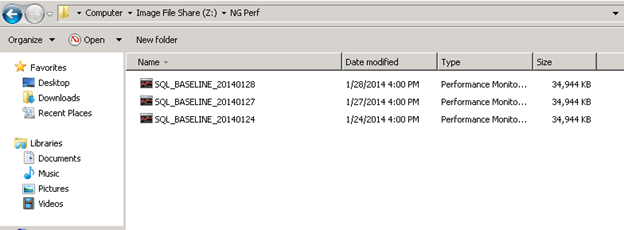
Once the command completes successfully, you should see the new file in the same directory:

SQL Freelancer SQL Server Perfmon Graph Excel

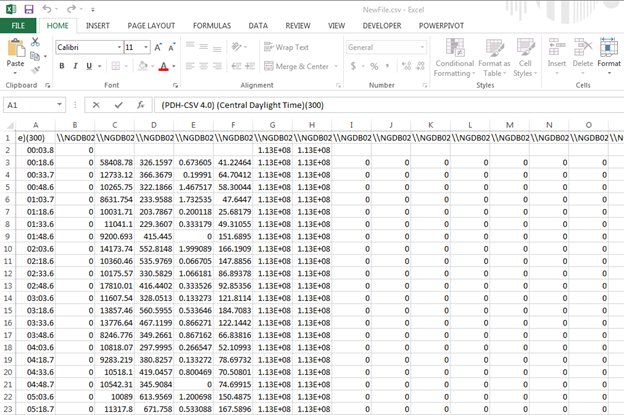
Open NewFile.csv in Excel:

SQL Freelancer SQL Server Perfmon Graph Excel

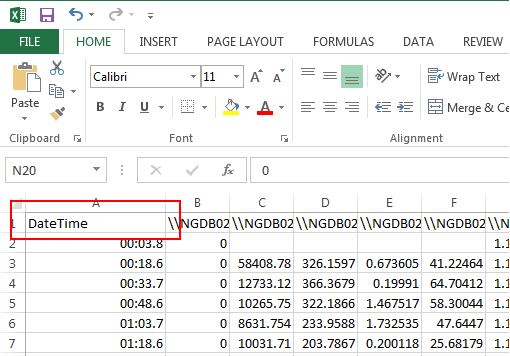
Not pretty huh? First thing we need to do is format the first column….which is the Date column. Change the text in the A1 cell from PDH-CSV 4.0…. to DateTime:

SQL Freelancer SQL Server Perfmon Graph Excel

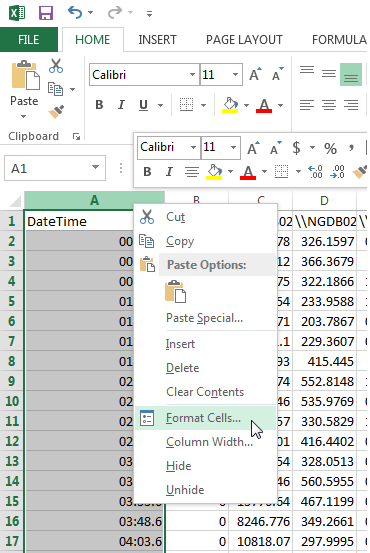
Next, remove Row 2. We do not need this data. Also, highlight column A and right click anywhere in the column and choose Format Cells:

SQL Freelancer SQL Server Perfmon Graph Excel

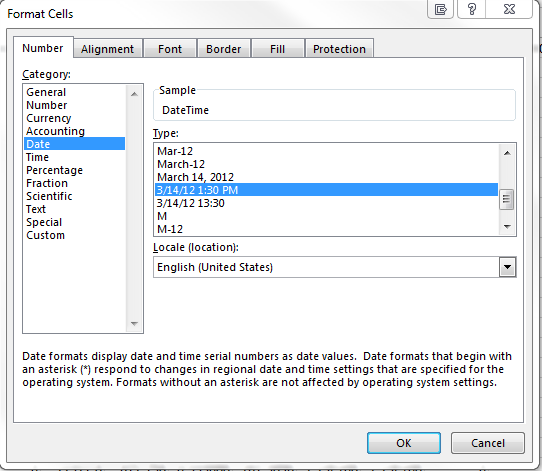
On the number tab, click the Data Category and select 3/14/2012 1:30PM:

SQL Freelancer SQL Server Perfmon Graph Excel

Press Ctrl+Home to select the A1 cell.

Create Pivot Chart

Click on the Insert tab and select Pivot Chart:

SQL Freelancer SQL Server Perfmon Graph Excel

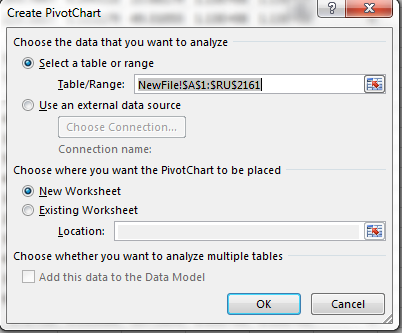
The Pivot Chart dialog box should automatically select the correct cells to analyze. If not, make sure all of the cells are selected:

SQL Freelancer SQL Server Perfmon Graph Excel

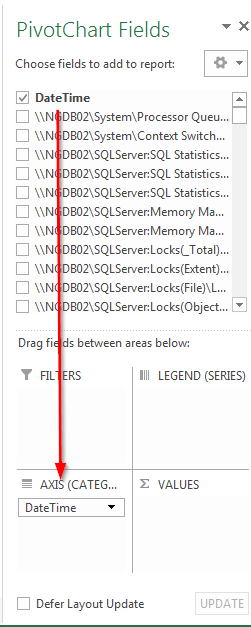
Once the new worksheet opens, drag DateTime to the Axis Fields pane:

SQL Freelancer SQL Server Perfmon Graph Excel

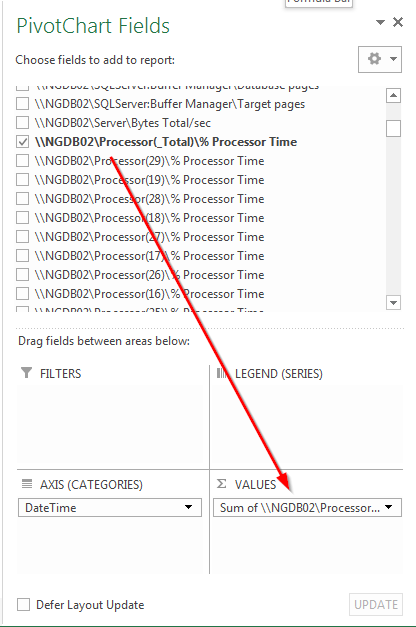
Now, depending on what counter(s) you want to analyze, drag it down to the Values pane. For this example, I’ll analyze Processor(_Total)\% Processor Time:

SQL Freelancer SQL Server Perfmon Graph Excel

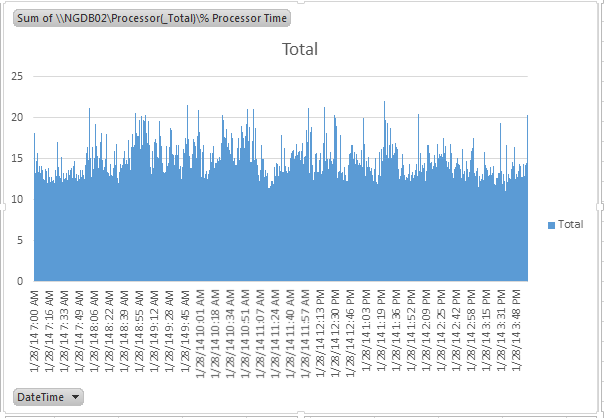
Ta da! You now have a graph that displays your Processor %.

SQL Freelancer SQL Server Perfmon Graph Excel

To make this presentable, simply format the graph to your liking and you’re done.

Power Query for Excel

In this post, I’ll discuss the prerequisites and how to install and enable Power Query (Data Explorer) and I’ll show you how to use this new feature.

Prerequisites:

  • Requires Microsoft Office 2010 SP1 or Microsoft Excel 2013 32-bit or 64-bit
  • Requires Windows Vista (with .Net 3.5 SP1 or greater), Windows Server 2008 (with .Net 3.5 SP1 or greater), Windows Server 2008 R2, Windows 7 or Windows 8.

Installation:

Download and install the preview from Microsoft Download Center

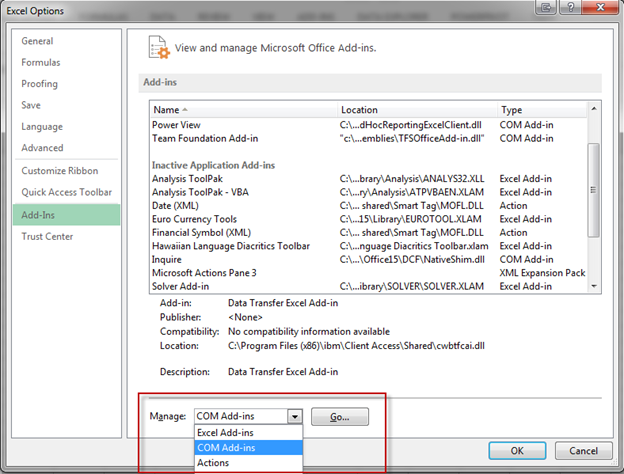
Once the feature is installed open Excel and go to File, Options, Add-Ins. Select COM Add-Ins and click Go.

SQL Freelancer SQL Server Excel Data Explorer Power Query BI
Check Microsoft “Data Explorer” Preview for Excel and click OK.
SQL Freelancer SQL Server Excel Data Explorer Power Query BI
Once Data Explorer has been enabled, the tab will appear above the Office ribbon.

SQL Freelancer SQL Server Excel Data Explorer Power Query BI

Now that we have Data Explorer installed and enabled we can get to the fun stuff.

To see a detailed list of each element you can visit Microsoft Data Explorer Help

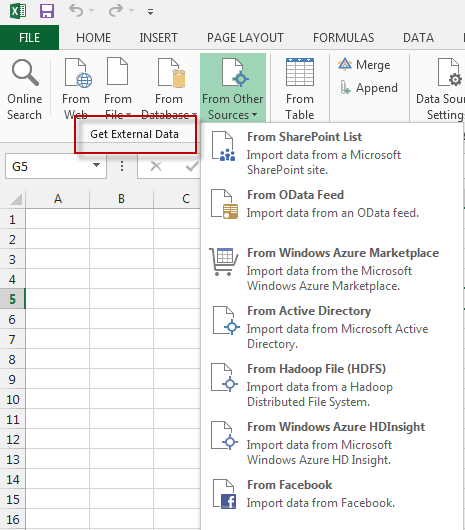
If you click on the Data Explorer tab you will notice Get External Data. Just like Excel and PowerPivot, this is where our data source will come from. There are multiple data sources to choose from including websites, files, databases, Active Directory, and even Facebook. Yes….Facebook.

SQL Freelancer SQL Server Excel Data Explorer Power Query BI

In this tip, I’ll show you examples of two data sources. We’ll pull data from a website and create a map report using PowerView and we’ll pull data from Facebook and make a report using PowerPivot.

Web Data Source

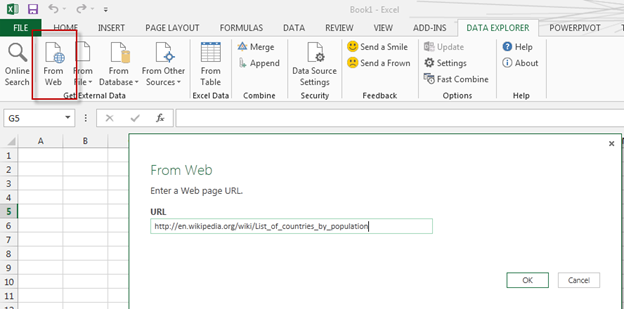
In the first example, I’ll pull table data from the web using Wikipedia. Choose “From Web” from the Get External Data section and use the following URL:http://en.wikipedia.org/wiki/List_of_countries_by_population

SQL Freelancer SQL Server Excel Data Explorer Power Query BI

Click OK

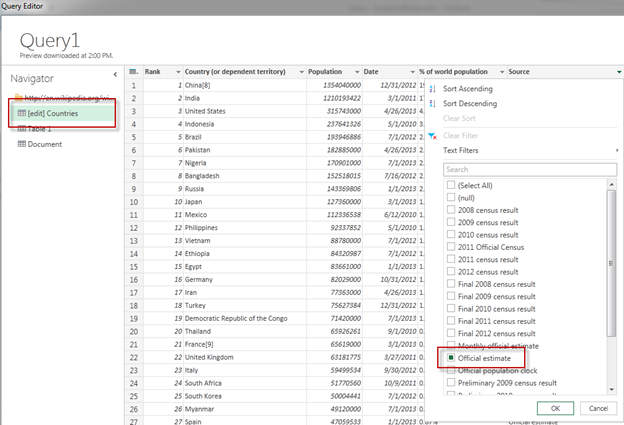
In the Query Editor under Navigator, select Countries. This will display rank, country, population, date, % of world population and source. We can filter columns just like in Excel by selecting the header arrow and choosing the appropriate filter. In this example, we’ll filter Source to only includes records that are an official estimate.

SQL Freelancer SQL Server Excel Data Explorer Power Query BI
Click here to view the rest of this post.

Microsoft’s new 3D data visualization BI product – Power Map

Microsoft has introduced a new BI product that will provide 3D data visualization using Bing Maps. This product is still in beta and is codenamed “GeoFlow” but should be out late 2013 or early 2014. This preview will allow you to plot geographic and temporal data visually, analyze that data in 3D, and create visual tours. It is a really cool product and I can’t wait to use it in a business atmosphere.

In this post, I’ll discuss the prerequisites and how to install “GeoFlow” and I’ll give an introduction on how to use this feature.

Prerequisites:

  • Requires Microsoft Office Professional Plus 2013 or Office 365 ProPlus
  • Supports 32-bit or 64-bit machines
  • Requires Windows 7, Windows 8, or Windows Server 2008R2 (requires .NET Framework 4.0)
  • Requires internet access

Installation

Download and install the preview from Microsoft Download Center (make sure Excel is closed while installing)

Open Excel and “Maps” will appear as a new item in the “Insert” tab of the Excel ribbon:

SQL Freelancer SQL Server Excel GeoFlow Power Map BI
Now that “GeoFlow is installed, we can begin using the new feature.

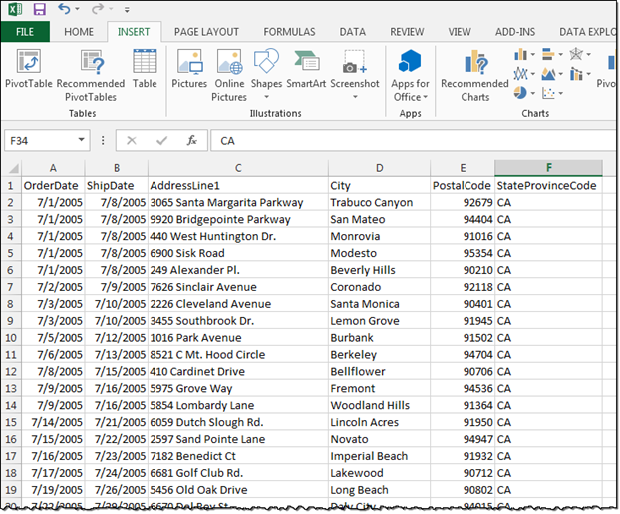
For this tip, I’m using the AdventureWorks2012 database and the result set from the following query imported into Excel:

  SELECT  
  OrderDate, 
  ShipDate, 
  AddressLine1, 
  City, 
  PostalCode, 
  StateProvinceCode
  FROM [AdventureWorks2012].[Sales].[SalesOrderHeader] soh
  JOIN [AdventureWorks2012].[Person].[Address] ps ON soh.ShipToAddressID = ps.AddressID
  JOIN [AdventureWorks2012].[Person].[StateProvince] psp ON psp.StateProvinceID = ps.StateProvinceID
  WHERE StateProvinceCode = 'CA'

SQL Freelancer SQL Server Excel GeoFlow Power Map BI
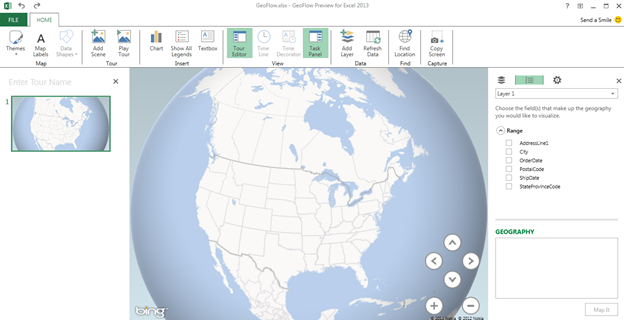
Once you have the data in Excel, click on the “Insert” tab on the Office ribbon and click Map. You should now see the “GeoFlow” globe:

SQL Freelancer SQL Server Excel GeoFlow Power Map BI
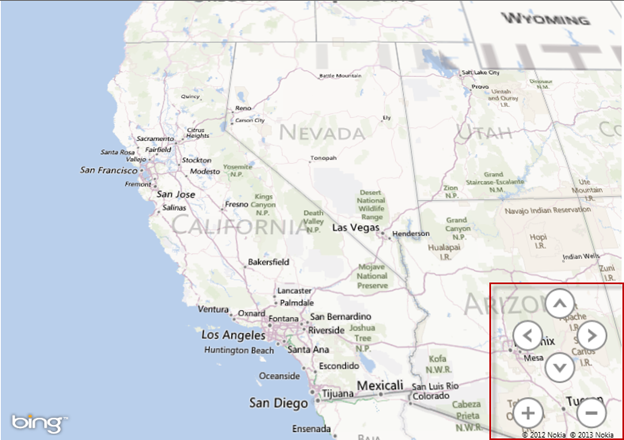
There are a few tabs you can use right away in the ribbon bar. Under the “Map” item you can change Themes and add Map Labels. I like to enable the Map labels so I can see a more detailed version of the map. You can also zoom in and out and move the map using the arrows and +/- buttons in the bottom right corner of the map.SQL Freelancer SQL Server Excel GeoFlow Power Map BI
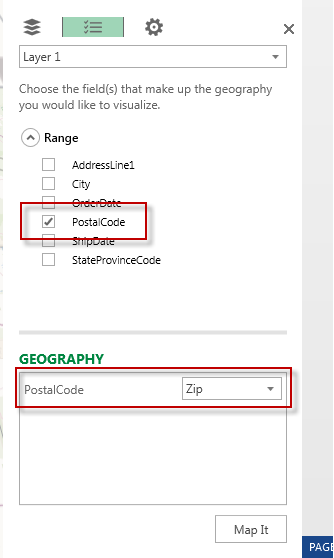
On the right side you see the “Layer” pane. This is where you will choose your geography visualizations. For this example Ill select “PostalCode” under the range section and since we know that this column stores zip codes we’ll map it to “Zip” under the Geography section:
SQL Freelancer SQL Server Excel GeoFlow Power Map BI

Once the fields are selected, click Map It.

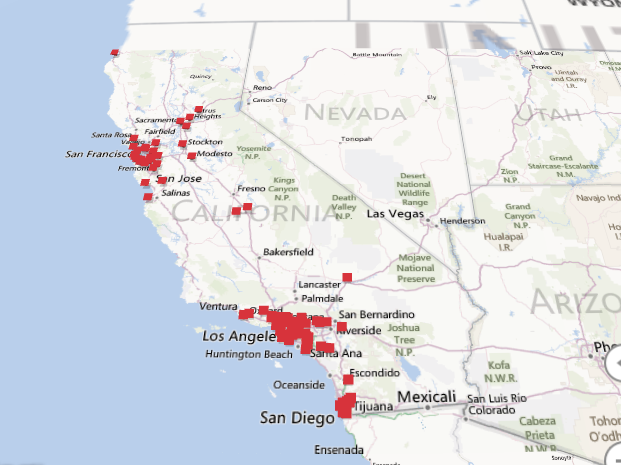
You might notice that 86 records were updated meaning that there are 86 unique zip codes in California and it placed a marker on each zip code:

SQL Freelancer SQL Server Excel GeoFlow Power Map BI
Click here to view the rest of this post.

Building Key Performance Indicators (KPIs) with PowerPivot

A KPI (Key Performance Indicator) is a graphical representation that displays progress against a predefined measure or business goal. KPIs make it easier for end users to evaluate the amount of progress without reading a bunch of data.

In this post, I’ll use AdventureWorksDW2012 sample data so you can follow along with me. The database can be downloaded here.
Let’s get started.

Enabling PowerPivot in Excel 2013

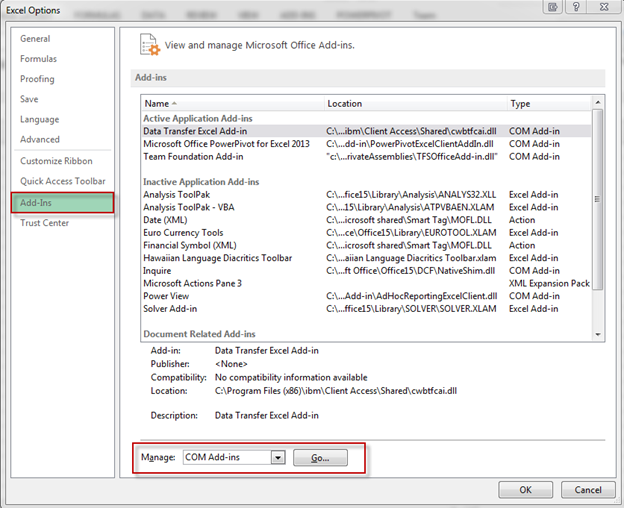
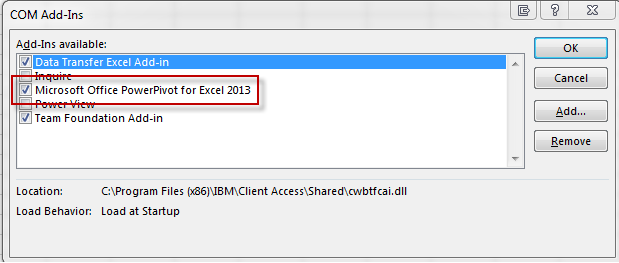
To enable PowerPivot, open Excel, go to File, Options, Add-Ins, select COM Add-ins and click Go. This will open up the COM Add-Ins dialog box. Click “Microsoft Office PowerPivot for Excel 2013” and hit OK. After successfully enabling PowerPivot, the tab should appear at the top of the Excel spreadsheet:

SQL Freelancer SQL Server PowerPivot KPI

Importing Data

Open Excel, click the PowerPivot tab, Manage:

SQL Freelancer SQL Server PowerPivot KPI
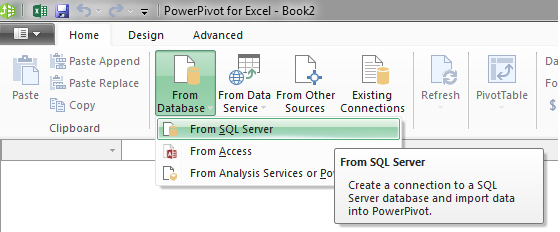
Upon clicking Manage, a new window should appear. From this window, you will import data. Click From Database and select From SQL Server:

SQL Freelancer SQL Server PowerPivot KPI
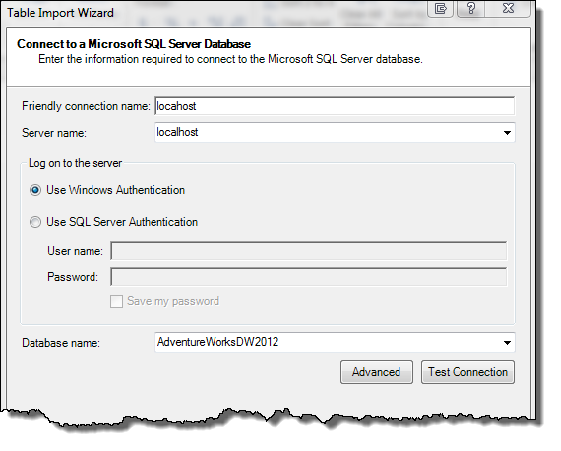
Type in the Server Name, Authentication mode, and browse to the AdventureWorksDW2012 database:
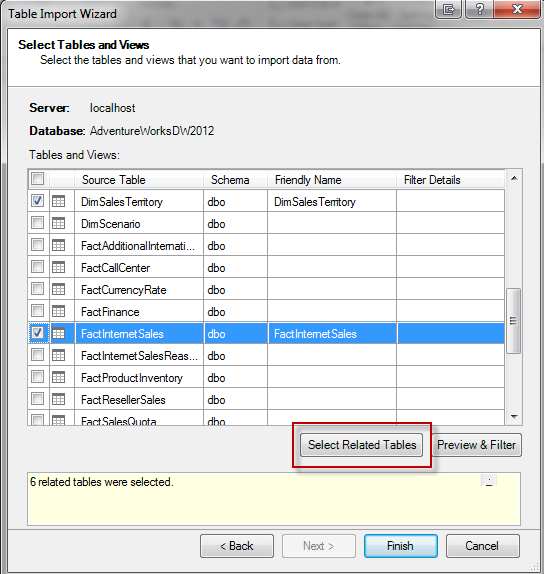
SQL Freelancer SQL Server PowerPivot KPIClick Next, choose “Select from a list of tables and views to choose the data to import” and click Next. The next screen is where we will select our data to import. For this example, choose FactInternetSales and click “Select Related Tables”. The Select Related Tables button enables you to automatically select every table that is related to the source table selected:

SQL Freelancer SQL Server PowerPivot KPI
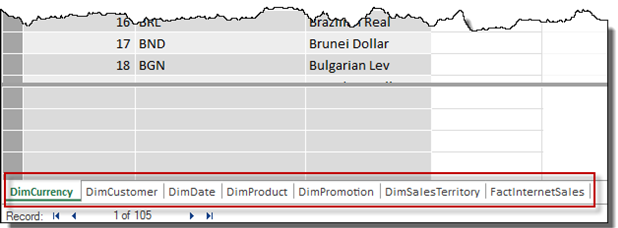
After clicking Finish, the import will begin. Once the import finishes successfully you should be able to view all the tables separated into sheets:

SQL Freelancer SQL Server PowerPivot KPI

Creating PivotTable

Before creating a KPI we will need to slice and dice our data into a PivotTable. To do this, click PivotTable on the ribbon bar and choose New Worksheet:

SQL Freelancer SQL Server PowerPivot KPI
Click here to view the rest of this post.

PowerPivot with Excel 2013

Excel 2013 changes things up a bit when it comes to installing PowerPivot. In previous versions you had to download the component and install, but with Excel 2013 it comes installed as an add-in, but disabled by default. To enable PowerPivot, open Excel, go to File, Options, Add-Ins, select COM Add-ins and click Go.

SQL Freelancer SQL Server Excel PowerPivot
This will open up the COM Add-Ins dialog box. Click “Microsoft Office PowerPivot for Excel 2013” and hit OK.

SQL Freelancer SQL Server Excel PowerPivot
After successfully enabling PowerPivot, the tab should appear at the top of the Excel spreadsheet.

SQL Freelancer SQL Server Excel PowerPivot

Creating a dashboard

There are a few different ways in which to import data into Excel to use with PowerPivot. Some of these ways include:

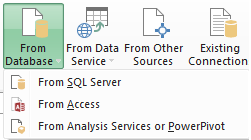
  • From database

SQL Freelancer SQL Server Excel PowerPivot

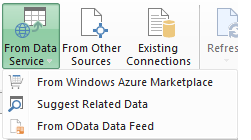
  • From Data Service

SQL Freelancer SQL Server Excel PowerPivot

  • From other sources such as Oracle, Excel, flat files, etc.

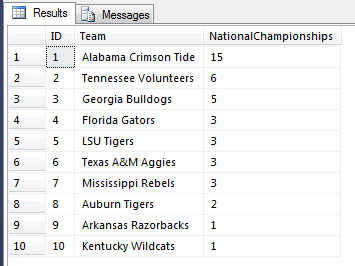
For this example, and simplicity sake, I will just run a query and simply copy and paste my results into the Excel spreadsheet. The query results look like this:

SQL Freelancer SQL Server Excel PowerPivot
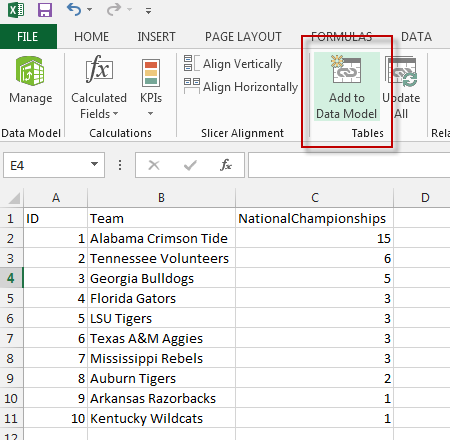
Once the results are copied and pasted into Excel, click the PowerPivot tab and click Add to Data Model:

SQL Freelancer SQL Server Excel PowerPivot
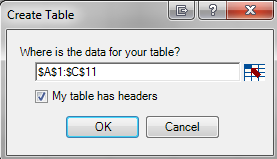
On the create table dialog box, make sure you select the range for your data and click “My table has headers”

SQL Freelancer SQL Server Excel PowerPivot
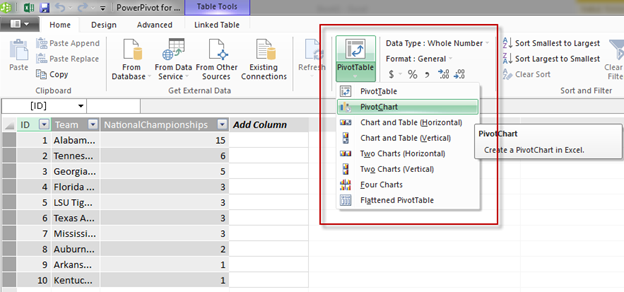
After clicking OK, the PowerPivot window should appear. To start creating the dashboard, click PivotTable, PivotChart, then select New Worksheet:

SQL Freelancer SQL Server Excel PowerPivot
Click here to view the rest of this post.