Fixing SQL Server error in-row data RSVD page count is incorrect

I ran DBCC CHECKDB (Integrity Checks) in my maintenance plan and I also ran it manually, but I keep getting the error “The In-row data RSVD page count for object “table_name” , index ID 0, partition ID 58037252456448, alloc unit ID 58037252456448 (type In-row data) is incorrect.” How can I fix this error?

Solution

Before we discuss the simple steps to fixing this error, let’s discuss what might have happened in this situation.

Anytime you see an integrity check error it might make you a little queasy. No need to worry on this error. If you have recently upgraded from SQL Server 2000 then this error is somewhat common. I know what you’re saying, “Why is there a tip regarding SQL Server 2000?” Trust me, a lot of people are still running SQL Server 2000 which is now out of compliance with Microsoft, so everyone is in a rush to upgrade. Anyway, SQL Server 2000 used to update the page space used metadata. Once SQL Server 2005 came along, this was no longer the case so if you didn’t run DBCC UPDATEUSAGE after the upgrade/migration this error is likely to appear when you run DBCC CHECKDB.

Here is what the error message looks like:

Msg 2508, Level 16, State 3, Line 1

The In-row data RSVD page count for object "table_name", index ID 0, partition ID 58037252456448,
alloc unit ID 58037252456448 (type In-row data) is incorrect. Run DBCC UPDATEUSAGE.

Running DBCC UPDATEUSAGE

If you notice in the maintenance plan or the DBCC CHECKDB results above, it displays “Run DBCC UPDATEUSAGE” after the error message. Ta da! After backing up your databases and establishing a maintenance window run DBCC UPDATEUSAGE (databasename). In a perfect world, SQL would notice this error and run DBCC UPDATEUSAGE on the appropriate table. This is not a perfect world, so we have to run it manually.

DBCC UPDATEUSAGE reports and corrects pages and row count inaccuracies in the catalog views. These inaccuracies may cause incorrect space usage reports returned by the sp_spaceused system stored procedure – MSDN.

 DBCC UPDATEUSAGE (Apollo32_Fixed)

After running DBCC UPDATEUSAGE (databasename) on my questionable database you can see that all the page counts have been updated:


DBCC UPDATEUSAGE: Usage counts updated for table 'UserList' (index 'UserList', partition 1):
        USED pages (In-row Data): changed from (5) to (4) pages.
DBCC UPDATEUSAGE: Usage counts updated for table 'UserRights' (index 'UserRights', partition 1):
        USED pages (In-row Data): changed from (72) to (24) pages.
        RSVD pages (In-row Data): changed from (80) to (33) pages.
DBCC UPDATEUSAGE: Usage counts updated for table 'UserRights' (index 'UserRights', partition 1):
        USED pages (In-row Data): changed from (5) to (4) pages.
DBCC UPDATEUSAGE: Usage counts updated for table 'UserGroups' (index 'UserGroups', partition 1):
        USED pages (In-row Data): changed from (4) to (3) pages.
DBCC UPDATEUSAGE: Usage counts updated for table 'Application' (index 'Application', partition 1):
        USED pages (In-row Data): changed from (3) to (2) pages.
        

You only need to run DBCC UPDATEUSAGE once. After the page counts have been corrected your SQL Server will be back to normal. If you do not fix this issue right away, page counts will continue to get worse when data is added and will result in abnormalities in space usage reports.

After the update, running DBCC CHECKDB gives me a clean database again:

CHECKDB found 0 allocation errors and 0 consistency errors in database ”database_name’. DBCC execution completed. If DBCC printed error messages, contact your system administrator.

In essence, DBCC UPDATEUSAGE updates the used, reserved, and rows columns of the sysindexes (later named sys.indexes in SQL Server 2005) table.

In this example I have two databases named Apollo32 and Apollo32_Fixed. When running an integrity check against Apollo32 I get the error described above. Apollo32_Fixed is a copy of Apollo32 after running DBCC UPDATEUSAGE.

Before and After Comparison

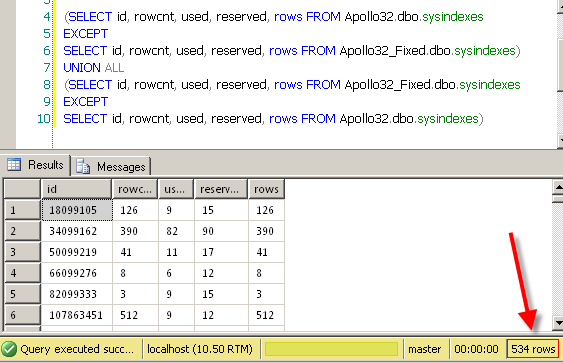
If I compare Apollo32.dbo.sysindexes to Apollo32_Fixed.dbo.sysindexes I can see I have 534 differences.

 (SELECT id, rowcnt, used, reserved, rows FROM Apollo32.dbo.sysindexes
EXCEPT
SELECT id, rowcnt, used, reserved, rows FROM Apollo32_Fixed.dbo.sysindexes)
UNION ALL
(SELECT id, rowcnt, used, reserved, rows FROM Apollo32_Fixed.dbo.sysindexes
EXCEPT
SELECT id, rowcnt, used, reserved, rows FROM Apollo32.dbo.sysindexes)

SQL Freelancer SQL Server RSVD fix
Click here to view the rest of this post.

Move an On Premise SQL Server Database to the SQL Azure Cloud

Most of us have heard of SQL Azure, but a lot of people have yet to adopt the “cloud” version of SQL Server. This post will focus on how to move an on premise database to the SQL Azure and Windows Azure VM. To learn how to get started with SQL Azure visit Microsoft’s Azure site.

Most of us are used to the “Restore Database” command found by right clicking the Databases container in SQL Server Management Studio (SSMS). SQL Azure has done away with this and instead only gives you the options below:

On premise database Azure database

SQL Freelancer SQL Server Azure

SQL Freelancer SQL Server Azure

This isn’t very helpful and can make you want to deactivate your Azure subscription immediately, but hold on…there is a way.

First, you will need to create a storage account from Windows Azure. To do this, log in to Azure and click Storage, New from the left pane:

SQL Freelancer SQL Server Azure
Click Quick Create, Enter a URL and Location, and click Create Storage Account:

SQL Freelancer SQL Server Azure

Once the storage is created you should be able to view and manage it by clicking on the storage item on the left pane.

Click Manage Access Keys and take note of the Storage Account Name and Primary Access Key:

SQL Freelancer SQL Server AzureSQL Freelancer SQL Server Azure
Next click on the storage name and click Containers, Create a Container:
SQL Freelancer SQL Server AzureSQL Freelancer SQL Server Azure
Back in SSMS, right click on the database you want to move to the cloud and choose Tasks, Export Data-tier Application:

SQL Freelancer SQL Server Azure
Click Save to Windows Azure and the Connect…button.

SQL Freelancer SQL Server Azure
Click here to view the rest of this post.

Identify and Correct SQL Server Forwarded Records

Forwarded records in SQL Server can cause performance issues on heap tables because the record outgrows the page and the database engine uses pointers to reference the data. For those that don’t know what a heap is, it is a table without a clustered index. The best practice is to have a clustered index on every table, however, sometimes there are cases when a clustered index is not needed. In this case, DBA’s should be aware of all heap tables and should be concerned about forwarded records causing poor performance.  In this post, I’ll discuss forwarded records and how fix them.

Forwarded records are records in a SQL Server table that have grown too large for the page that it currently resides on.  These types of records can only be found in heaps because tables with a clustered index keep the data sorted based on the clustered index.  With a heap, once the record outgrows the page, the record is moved to a new page and a forwarding pointer is left in the original location to point to the new location.

Let’s look at an example of a forwarding record.

First, let’s create a table and insert some records:

CREATE TABLE [dbo].[Demo](
 [ID] [int] IDENTITY(1,1),
 [Server] [nvarchar](50) NULL,
 [DatabaseName] [nvarchar](100) NULL,
 [timestamp] [datetime] default getdate())
GO 
    CREATE INDEX idx_Server ON Demo(Server)
GO
    INSERT INTO Demo
    (Server,DatabaseName)
    VALUES  ('Server1', 'DB1') 
    INSERT INTO Demo
    (Server,DatabaseName)
    VALUES  ('Server2', 'DB2')
    INSERT INTO Demo
    (Server,DatabaseName)
    VALUES  ('Server3', 'DB3')
GO 100

SQL Freelancer SQL Server Forwarded Records
Next, let’s use the following DMV query to check our table:

SELECT
    OBJECT_NAME(ps.object_id) as TableName,
    i.name as IndexName,
    ps.index_type_desc,
    ps.page_count,
    ps.avg_fragmentation_in_percent,
    ps.forwarded_record_count
FROM sys.dm_db_index_physical_stats (DB_ID(), NULL, NULL, NULL, 'DETAILED') AS ps
INNER JOIN sys.indexes AS i
    ON ps.OBJECT_ID = i.OBJECT_ID  
    AND ps.index_id = i.index_id
WHERE OBJECT_NAME(ps.object_id) = 'Demo'

SQL Freelancer SQL Server Forwarded Records

Notice that the HEAP index type has 0 forwarded records.

Next we will change the table definition by modifying the DatabaseName column.

ALTER TABLE Demo ALTER COLUMN [DatabaseName] nvarchar(MAX)

If we run the DMV query again you will see that the forwarded_record_count has changed (along with a lot of fragmentation):

SQL Freelancer SQL Server Forwarded Records

The page count increased to 3 on the HEAP indicating that a new page was created and 50 forwarded records were created.

In a real world situation you will probably not know exactly when this happens so by changing the WHERE clause in the DMV query you can find all the forwarded records in a database. I would monitor heap tables at least monthly and if you notice high I/O on a heap, then that should be a hint that something needs to be looked at and possibly modified.

SELECT
    OBJECT_NAME(ps.object_id) as TableName,
    i.name as IndexName,
    ps.index_type_desc,
    ps.page_count,
    ps.avg_fragmentation_in_percent,
    ps.forwarded_record_count
FROM sys.dm_db_index_physical_stats (DB_ID(), NULL, NULL, NULL, 'DETAILED') AS ps
INNER JOIN sys.indexes AS i
    ON ps.OBJECT_ID = i.OBJECT_ID  
    AND ps.index_id = i.index_id
WHERE forwarded_record_count > 0

On my Test DB, you will notice I have two HEAP tables that have forwarded records including the one I just created.

SQL Freelancer SQL Server Forwarded Records
Click here to view the rest of this post.

Power Query for Excel

In this post, I’ll discuss the prerequisites and how to install and enable Power Query (Data Explorer) and I’ll show you how to use this new feature.

Prerequisites:

  • Requires Microsoft Office 2010 SP1 or Microsoft Excel 2013 32-bit or 64-bit
  • Requires Windows Vista (with .Net 3.5 SP1 or greater), Windows Server 2008 (with .Net 3.5 SP1 or greater), Windows Server 2008 R2, Windows 7 or Windows 8.

Installation:

Download and install the preview from Microsoft Download Center

Once the feature is installed open Excel and go to File, Options, Add-Ins. Select COM Add-Ins and click Go.

SQL Freelancer SQL Server Excel Data Explorer Power Query BI
Check Microsoft “Data Explorer” Preview for Excel and click OK.
SQL Freelancer SQL Server Excel Data Explorer Power Query BI
Once Data Explorer has been enabled, the tab will appear above the Office ribbon.

SQL Freelancer SQL Server Excel Data Explorer Power Query BI

Now that we have Data Explorer installed and enabled we can get to the fun stuff.

To see a detailed list of each element you can visit Microsoft Data Explorer Help

If you click on the Data Explorer tab you will notice Get External Data. Just like Excel and PowerPivot, this is where our data source will come from. There are multiple data sources to choose from including websites, files, databases, Active Directory, and even Facebook. Yes….Facebook.

SQL Freelancer SQL Server Excel Data Explorer Power Query BI

In this tip, I’ll show you examples of two data sources. We’ll pull data from a website and create a map report using PowerView and we’ll pull data from Facebook and make a report using PowerPivot.

Web Data Source

In the first example, I’ll pull table data from the web using Wikipedia. Choose “From Web” from the Get External Data section and use the following URL:http://en.wikipedia.org/wiki/List_of_countries_by_population

SQL Freelancer SQL Server Excel Data Explorer Power Query BI

Click OK

In the Query Editor under Navigator, select Countries. This will display rank, country, population, date, % of world population and source. We can filter columns just like in Excel by selecting the header arrow and choosing the appropriate filter. In this example, we’ll filter Source to only includes records that are an official estimate.

SQL Freelancer SQL Server Excel Data Explorer Power Query BI
Click here to view the rest of this post.

Microsoft’s new 3D data visualization BI product – Power Map

Microsoft has introduced a new BI product that will provide 3D data visualization using Bing Maps. This product is still in beta and is codenamed “GeoFlow” but should be out late 2013 or early 2014. This preview will allow you to plot geographic and temporal data visually, analyze that data in 3D, and create visual tours. It is a really cool product and I can’t wait to use it in a business atmosphere.

In this post, I’ll discuss the prerequisites and how to install “GeoFlow” and I’ll give an introduction on how to use this feature.

Prerequisites:

  • Requires Microsoft Office Professional Plus 2013 or Office 365 ProPlus
  • Supports 32-bit or 64-bit machines
  • Requires Windows 7, Windows 8, or Windows Server 2008R2 (requires .NET Framework 4.0)
  • Requires internet access

Installation

Download and install the preview from Microsoft Download Center (make sure Excel is closed while installing)

Open Excel and “Maps” will appear as a new item in the “Insert” tab of the Excel ribbon:

SQL Freelancer SQL Server Excel GeoFlow Power Map BI
Now that “GeoFlow is installed, we can begin using the new feature.

For this tip, I’m using the AdventureWorks2012 database and the result set from the following query imported into Excel:

  SELECT  
  OrderDate, 
  ShipDate, 
  AddressLine1, 
  City, 
  PostalCode, 
  StateProvinceCode
  FROM [AdventureWorks2012].[Sales].[SalesOrderHeader] soh
  JOIN [AdventureWorks2012].[Person].[Address] ps ON soh.ShipToAddressID = ps.AddressID
  JOIN [AdventureWorks2012].[Person].[StateProvince] psp ON psp.StateProvinceID = ps.StateProvinceID
  WHERE StateProvinceCode = 'CA'

SQL Freelancer SQL Server Excel GeoFlow Power Map BI
Once you have the data in Excel, click on the “Insert” tab on the Office ribbon and click Map. You should now see the “GeoFlow” globe:

SQL Freelancer SQL Server Excel GeoFlow Power Map BI
There are a few tabs you can use right away in the ribbon bar. Under the “Map” item you can change Themes and add Map Labels. I like to enable the Map labels so I can see a more detailed version of the map. You can also zoom in and out and move the map using the arrows and +/- buttons in the bottom right corner of the map.SQL Freelancer SQL Server Excel GeoFlow Power Map BI
On the right side you see the “Layer” pane. This is where you will choose your geography visualizations. For this example Ill select “PostalCode” under the range section and since we know that this column stores zip codes we’ll map it to “Zip” under the Geography section:

SQL Freelancer SQL Server Excel GeoFlow Power Map BI

Once the fields are selected, click Map It.

You might notice that 86 records were updated meaning that there are 86 unique zip codes in California and it placed a marker on each zip code:

SQL Freelancer SQL Server Excel GeoFlow Power Map BI
Click here to view the rest of this post.

SQL Server Simple and Forced Parameterization

There are two different parameterization options that one can use in SQL Server. Simple parameterization and Forced parameterization. Let’s discuss each a little more in detail.

Simple Parameterization

When you execute a SQL statement without parameters, SQL Server internally will add parameters where needed so that it can try to reuse a cached execution plan. For example, if you look at the execution plan of the following statement you will see that SQL Server changes the WHERE value to a parameter (@1):

SELECT * FROM AdventureWorks2012.Sales.CreditCard WHERE CreditCardID = 11

SQL Freelancer SQL Server Parameterization

SQL Server builds this execution plan as if a parameter was the input instead of the number 11. Because of this parameterization, the following two statements show an example of SQL Server reusing the same execution plan even though the data results are different:

SELECT * FROM AdventureWorks2012.Sales.CreditCard WHERE CreditCardID = 11
SELECT * FROM AdventureWorks2012.Sales.CreditCard WHERE CreditCardID = 207

SQL Freelancer SQL Server Parameterization

This is the default behavior for Simple parameterization, however, it only applies to a small class of queries. If you want all your queries parameterized, you will need to enable the option, Forced parameterization.

Forced Parameterization

Forced parameterization is when the database engine parameterizes any literal value that appears in a SELECT, UPDATE, INSERT, or DELETE statement submitted in any form, but there are a few exceptions.  Refer to this article for a list of these exceptions.

Some applications use queries that pass in literals as opposed to stored procedures that pass in parameters. For these type of applications you may want to experiment with enabling Forced parameterization to see if it has a positive effect on the workload by reducing query compilations.

Running the following query in Simple parameterization produces the following execution plan where the WHERE clause is not parameterized:

SQL Freelancer SQL Server Parameterization
Click here to view the rest of this post.

Using the SSIS WMI Task to Gather System Information

Finding server information is vital when monitoring servers and is usually pretty easy to find on SQL Servers, however when monitoring web or app servers this may be a bit of a challenge when SQL querying is not at your disposal. This post will talk about the SSIS task “WMI Data Reader” and how it can help you monitor your non-SQL Servers.

First, a short introduction to WMI….

WMI (Windows Management Instrumentation) is used for accessing management information in an enterprise environment. The ability to obtain management data from remote computers is what makes WMI useful. It provides a consistent approach to carrying out day-to-day management tasks with programming or scripting languages – MSDN

Some things you can do with WMI may include:

  • Rebooting a computer remotely
  • Get a list of applications installed on a local or remote computer
  • Find OS info such as the version of Windows and service pack levels
  • Query the event logs on a local or remote computer
  • Find system information such as Manufacturer and Model of a computer

As you can see, WMI is a very powerful tool and can be used locally or remotely.

There are tons of different metrics you can capture using WMI scripts, but for this example I’ll capture disk space information using the Win32_LogicalDisk class and insert it into a database table using a SSIS package.

First, let’s create our database table that will store our disk information:

CREATE TABLE DiskInfo
(
Drive varchar(4),
DriveSize numeric(18,2),
FreeSpace numeric(18,2),
[Date] Datetime Not NUll Default GetDate()
)

Once our table is created, we can create the SSIS package. Open BIDS or SSDT and create a new Integration Services project.

SQL Freelancer SQL Server SSIS WMI
From the SSIS toolbox, drag the WMI Data Reader Task into the Design view.

SQL Freelancer SQL Server SSIS WMI

Right click in the Connection Manager window and select New Connection and select WMI. Click Add:

SQL Freelancer SQL Server SSIS WMISQL Freelancer SQL Server SSIS WMI
This will open the WMI Connection Manager Editor. Give the connection manager a name and description. If you are creating the package for a local computer then use \\localhost to connect. If you are creating the package for a remote server then use \\RemoteServer to connect. For this example, I’m connecting locally using Windows Authentication:

SQL Freelancer SQL Server SSIS WMI

Next we’ll need to right click on the WMI Data Reader Task and choose edit. Click the WMI Options tab. This tab is where we will need to input information such as the WMI connection string and the WMI query. For this example, I have used the following:

  • WMI connection – This is the connection we created in the previous step.
  • WqlQuerySourceType – Direct input
  • WqlQuerySource – Select Name, Size, FreeSpace From Win32_LogicalDisk Where DriveType = 3
  • OutputType – Data table
  • OverwriteDestination – Overwrite destination
  • DestinationType – File connection
  • Destination – New destination (see below)

SQL Freelancer SQL Server SSIS WMI
Click here to view the rest of this post.

Building Key Performance Indicators (KPIs) with PowerPivot

A KPI (Key Performance Indicator) is a graphical representation that displays progress against a predefined measure or business goal. KPIs make it easier for end users to evaluate the amount of progress without reading a bunch of data.

In this post, I’ll use AdventureWorksDW2012 sample data so you can follow along with me. The database can be downloaded here.

Let’s get started.

Enabling PowerPivot in Excel 2013

To enable PowerPivot, open Excel, go to File, Options, Add-Ins, select COM Add-ins and click Go. This will open up the COM Add-Ins dialog box. Click “Microsoft Office PowerPivot for Excel 2013” and hit OK. After successfully enabling PowerPivot, the tab should appear at the top of the Excel spreadsheet:

SQL Freelancer SQL Server PowerPivot KPI

Importing Data

Open Excel, click the PowerPivot tab, Manage:

SQL Freelancer SQL Server PowerPivot KPI
Upon clicking Manage, a new window should appear. From this window, you will import data. Click From Database and select From SQL Server:

SQL Freelancer SQL Server PowerPivot KPI
Type in the Server Name, Authentication mode, and browse to the AdventureWorksDW2012 database:
SQL Freelancer SQL Server PowerPivot KPIClick Next, choose “Select from a list of tables and views to choose the data to import” and click Next. The next screen is where we will select our data to import. For this example, choose FactInternetSales and click “Select Related Tables”. The Select Related Tables button enables you to automatically select every table that is related to the source table selected:

SQL Freelancer SQL Server PowerPivot KPI
After clicking Finish, the import will begin. Once the import finishes successfully you should be able to view all the tables separated into sheets:

SQL Freelancer SQL Server PowerPivot KPI

Creating PivotTable

Before creating a KPI we will need to slice and dice our data into a PivotTable. To do this, click PivotTable on the ribbon bar and choose New Worksheet:

SQL Freelancer SQL Server PowerPivot KPI
Click here to view the rest of this post.

Detecting CPU Pressure

There are a few different ways to detect CPU pressure, for example, Performance Monitor or SQL Profiler, but in this tip we’ll discuss the wait type SOS_SCHEDULER_YIELD and the DMV sys.dm_os_schedulers.

Some of you might have seen the wait type SOS_SCHEDULER_YIELD and wondered what in the world is this? Books Online (BOL) describes this wait type as:

Occurs when a task voluntarily yields the scheduler for other tasks to execute. During this wait the task is waiting for its quantum to be renewed.

SOS_SCHEDULER_YIELD is a fairly common wait type and occurs when there is CPU pressure. SQL Server runs multiple threads and tries to allow all threads to run without problems. However, if all the threads are busy on each scheduler and can’t let other threads run, it will yield itself for another thread, which in turn creates the SOS_SCHEDULER_YIELD wait type.

You can see the top wait stats and the percentage of waits at the current point in time by running the following query by Tim Ford and Glenn Berry.

WITH Waits AS 
( 
SELECT 
wait_type, 
wait_time_ms / 1000. AS wait_time_s, 
100. * wait_time_ms / SUM(wait_time_ms) OVER() AS pct, 
ROW_NUMBER() OVER(ORDER BY wait_time_ms DESC) AS rn 
FROM sys.dm_os_wait_stats 
WHERE wait_type 
NOT IN 
('CLR_SEMAPHORE', 'LAZYWRITER_SLEEP', 'RESOURCE_QUEUE', 
'SLEEP_TASK', 'SLEEP_SYSTEMTASK', 'SQLTRACE_BUFFER_FLUSH', 'WAITFOR', 
'CLR_AUTO_EVENT', 'CLR_MANUAL_EVENT') 
) -- filter out additional irrelevant waits 
SELECT W1.wait_type, 
CAST(W1.wait_time_s AS DECIMAL(12, 2)) AS wait_time_s, 
CAST(W1.pct AS DECIMAL(12, 2)) AS pct, 
CAST(SUM(W2.pct) AS DECIMAL(12, 2)) AS running_pct 
FROM Waits AS W1 
INNER JOIN Waits AS W2 ON W2.rn <= W1.rn 
GROUP BY W1.rn, 
W1.wait_type, 
W1.wait_time_s, 
W1.pct 
HAVING SUM(W2.pct) - W1.pct < 95; -- percentage threshold;

After running this query on one of my servers I can see that only 2.22% of my waits are due to CPU pressure so I can rule that out as a cause for poor performance. (This is only current since the last SQL Service restart):

SQL Freelancer SQL Server CPU Pressure DMV

If you see a high percentage of this wait type then one way of troubleshooting this is to use the DMV sys.dm_os_schedulers. BOL describes sys.dm_os_schedulers as:

Returns one row per scheduler in SQL Server where each scheduler is mapped to an individual processor. Use this view to monitor the condition of a scheduler or to identify runaway tasks.

This DMV has several columns including number or workers, active tasks, and the status of each scheduler, etc., which can help troubleshoot certain problems, but the most important column is the one used for measuring queued tasks, the runnable_tasks_count column. This column displays the count of tasks yielding to other tasks resulting in a SOS_SCHEDULER_YIELD wait type. If this column is frequently greater than 0 then CPU pressure may be present and blocking may occur.

To see an average of current tasks and current waiting tasks you can use the following query:

SELECT AVG(current_tasks_count) AS [Avg Current Task], 
AVG(runnable_tasks_count) AS [Avg Wait Task]
FROM sys.dm_os_schedulers
WHERE scheduler_id < 255
AND status = 'VISIBLE ONLINE'

SQL Freelancer SQL Server CPU Pressure DMV
Click here to view the rest of this post.

PowerPivot with Excel 2013

Excel 2013 changes things up a bit when it comes to installing PowerPivot. In previous versions you had to download the component and install, but with Excel 2013 it comes installed as an add-in, but disabled by default. To enable PowerPivot, open Excel, go to File, Options, Add-Ins, select COM Add-ins and click Go.

SQL Freelancer SQL Server Excel PowerPivot
This will open up the COM Add-Ins dialog box. Click “Microsoft Office PowerPivot for Excel 2013” and hit OK.

SQL Freelancer SQL Server Excel PowerPivot
After successfully enabling PowerPivot, the tab should appear at the top of the Excel spreadsheet.

SQL Freelancer SQL Server Excel PowerPivot

Creating a dashboard

There are a few different ways in which to import data into Excel to use with PowerPivot. Some of these ways include:

  • From database

SQL Freelancer SQL Server Excel PowerPivot

  • From Data Service

SQL Freelancer SQL Server Excel PowerPivot

  • From other sources such as Oracle, Excel, flat files, etc.

For this example, and simplicity sake, I will just run a query and simply copy and paste my results into the Excel spreadsheet. The query results look like this:

SQL Freelancer SQL Server Excel PowerPivot
Once the results are copied and pasted into Excel, click the PowerPivot tab and click Add to Data Model:

SQL Freelancer SQL Server Excel PowerPivot
On the create table dialog box, make sure you select the range for your data and click “My table has headers”

SQL Freelancer SQL Server Excel PowerPivot
After clicking OK, the PowerPivot window should appear. To start creating the dashboard, click PivotTable, PivotChart, then select New Worksheet:

SQL Freelancer SQL Server Excel PowerPivot
Click here to view the rest of this post.