Third party tools are awesome for capturing performance metrics, but some small shops (and even large shops) don’t budget for this type of software leaving it up to the DBA to create their own monitoring solution.
There are a few different ways to capture certain performance metrics, but in this post I’ll focus on using the sys.dm_os_performance_counters DMV and how to view this data in a more readable form using SQL Server Reporting Services graphs. The DMV doesn’t include all the counters as Performance Monitor, but it does show the SQL Server related counters. (Note that some of the counters in this DMV are of cumulative values since the last reboot.)
You can query this DMV using the following query:
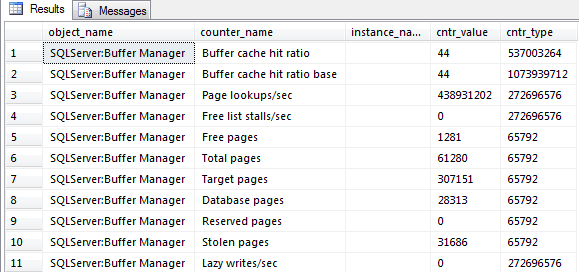
SELECT * FROM sys.dm_os_performance_counters

As you can see from the screenshot above, this can be hard to read. Also, it only shows the current values at the time the query is executed so you don’t know anything about the past and it makes it hard to see how the data fluctuates during the business day.
Collecting the SQL Server Monitoring Report Data
For the purpose of simplicity, this tip will focus on one counter, Page Life Expectancy (PLE). I’ll show you how to capture data and create a graph for analysis.
First, we’ll need to create a table that will store our metrics:
[ID] [int] IDENTITY(1,1) NOT NULL,
[object_name] [varchar](128) NOT NULL,
[counter_name] [varchar](128) NOT NULL,
[cntr_value] [bigint] NOT NULL,
[collection_datetime] [datetime] NOT NULL )
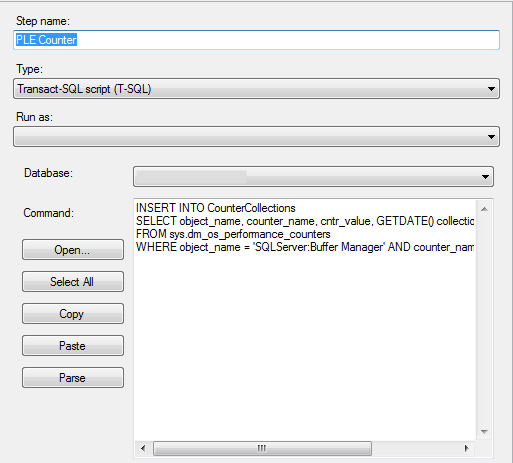
Next, we’ll need to create a script that will insert our data into the table we created above:
SELECT object_name, counter_name, cntr_value, GETDATE() collection_datetime
FROM sys.dm_os_performance_counters
WHERE object_name = ‘SQLServer:Buffer Manager’
AND counter_name = ‘Page life expectancy’
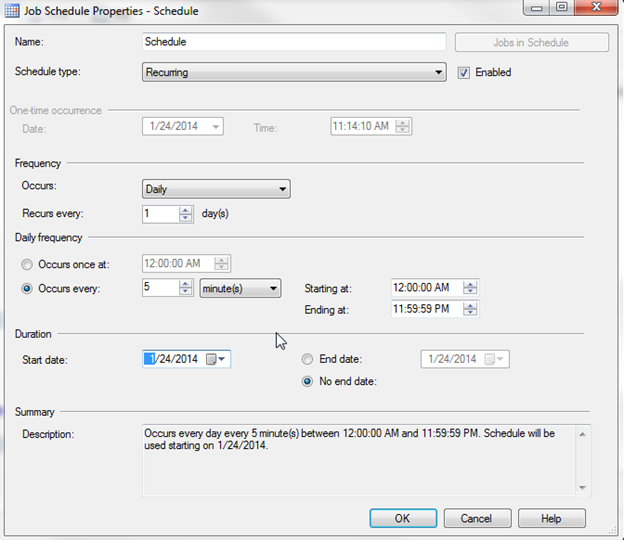
Finally, we’ll need to create a SQL Server Agent Job that will run the script above on a specified schedule:

I’ll run this job every 5 minutes:
Creating the SQL Server Monitoring Report
While the table gathers data we can switch over to Business Intelligence Development Studio (BIDS) or the SQL Server Data Tools (SSDT) and create a SSRS Report that will display our data.
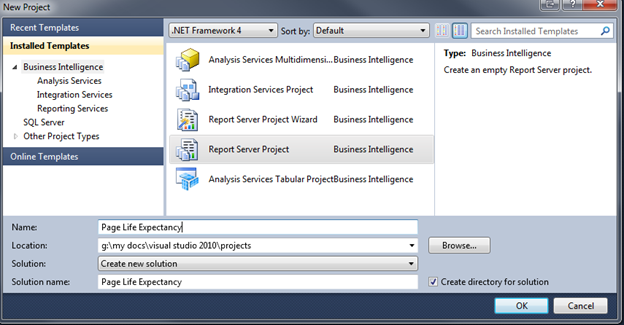
In this example, I’m using SSDT. Choose File, New Project. On the New Project dialog choose Report Server Project and name the Project:


Great blog. Cheers for sharing.