Performance Tuning Series – Monitoring and Alerts: Staying Ahead of Issues

A proactive approach to monitoring and alerting is key to maintaining SQL Server performance. Monitoring provides real-time insight into the database’s health, resource consumption, and potential bottlenecks, while alerts enable prompt responses to issues before they impact users. SQL Server’s built-in tools, along with third-party solutions, offer effective ways to track key performance metrics, identify anomalies, and set up automated alerts to help stay ahead of performance problems.

Why Monitoring and Alerts Matter for Performance Optimization

Constantly changing workloads, hardware constraints, and system settings make SQL Server performance unpredictable. Monitoring helps identify trends and sudden deviations in performance, allowing for preventive measures or optimizations before they become critical. Alerts provide early warnings for issues like high CPU usage, long-running queries, or approaching storage limits, enabling quick intervention.

Key Monitoring and Alerting Best Practices for SQL Server

1. Define Key Performance Indicators (KPIs)

Before setting up a monitoring system, it’s essential to establish which metrics or KPIs best represent your SQL Server’s health and performance. These indicators should cover areas such as CPU, memory, disk usage, and specific SQL Server metrics.

  • Best Practice:
    • Track essential KPIs, including CPU utilization, memory usage, disk I/O, query wait times, and buffer cache hit ratio.
    • For databases with heavy I/O demands, monitor page life expectancy (PLE), which shows how long a data page stays in the buffer cache.
    • Keep an eye on log growth and transaction log space usage for signs of excessive logging, which may indicate poorly optimized queries or large transactions.

2. Use Dynamic Management Views (DMVs) for Real-Time Monitoring

SQL Server’s Dynamic Management Views (DMVs) provide valuable insights into system performance by capturing real-time data on query execution, memory usage, and index efficiency. DMVs are essential for identifying specific issues that require immediate attention.

  • Best Practice:
    • Use DMVs like sys.dm_exec_query_stats to identify long-running or resource-intensive queries and sys.dm_os_wait_stats to understand wait types and locate bottlenecks.
    • Regularly analyze index usage using sys.dm_db_index_usage_stats to determine which indexes are frequently used and which are candidates for removal.
    • Automate DMV queries to gather data at regular intervals and retain historical performance data for trend analysis.

3. Set Up SQL Server Performance Alerts

SQL Server Agent allows you to configure alerts for specific events, such as high CPU or memory usage, job failures, or database connection issues. Alerts can be sent via email or logged to a table for review.

  • Best Practice:
    • Configure alerts for CPU usage exceeding 80%, memory pressure warnings, blocked processes, disk space thresholds, and failed SQL Agent jobs.
    • Set up alerts for critical wait types, like PAGEIOLATCH for disk-related bottlenecks or LCK_M_* for blocking and locking issues.
    • Ensure that alerts provide actionable information and avoid alert fatigue by fine-tuning alert thresholds and focusing on the most critical metrics.

4. Utilize SQL Server Extended Events for Detailed Diagnostics

SQL Server Extended Events offers a lightweight, customizable framework for tracking detailed performance data. Extended Events can capture detailed information on query execution, deadlocks, wait times, and system-level events without a significant performance impact.

  • Best Practice:
    • Create custom Extended Events sessions to capture specific performance issues, like long-running queries or high wait times.
    • Use Extended Events to monitor deadlocks and capture the SQL text, session ID, and resources involved for troubleshooting.
    • Archive Extended Events data for historical analysis, as this information is valuable for identifying recurring issues or performance trends.

5. Implement Database Monitoring Tools

In addition to built-in tools, various third-party solutions (e.g., SolarWinds, Redgate SQL Monitor, and Idera SQL Diagnostic Manager) provide advanced monitoring and alerting capabilities for SQL Server. These tools often offer features like dashboards, reporting, automated analysis, and recommendations.

  • Best Practice:
    • Choose a tool that provides real-time monitoring, historical trend analysis, and robust alerting based on your organization’s needs and budget.
    • Look for monitoring solutions that include visualizations for easy diagnosis of issues like query bottlenecks or resource contention.
    • Use third-party tools that support customizable alerts and integrate with incident management systems to streamline response workflows.

6. Monitor Query Performance

Query performance is one of the most significant factors affecting SQL Server’s efficiency. Using monitoring to detect slow or inefficient queries helps with timely tuning and optimization.

  • Best Practice:
    • Regularly monitor query execution times, CPU and I/O usage for top-running queries, and identify queries that are consistently resource-intensive.
    • Use Query Store in SQL Server to track query plans and execution statistics, making it easier to identify performance regressions after schema changes or updates.
    • Set alerts for queries running above a specific threshold or those with high execution counts that may indicate inefficiencies.

7. Monitor Tempdb Usage

Since tempdb is frequently used for temporary storage, sorting, and intermediate query results, high tempdb usage or contention can degrade performance. Monitoring tempdb ensures that it has adequate space and can handle temporary object creation demands.

  • Best Practice:
    • Monitor tempdb space usage using DMVs like sys.dm_db_task_space_usage and sys.dm_db_session_space_usage.
    • Configure alerts for tempdb growth or high utilization, which could indicate inefficient query processing or excessive use of temporary tables.
    • Use monitoring to detect contention on tempdb, especially on system pages like PFS, GAM, and SGAM, and address it by adding more data files.

8. Create Custom Alerts for Resource-Specific Metrics

Different applications and workloads may have unique performance demands, so SQL Server supports custom alerts tailored to your specific environment. Custom alerts allow more granular monitoring of resource-specific metrics, such as long lock times or unusually high I/O operations.

  • Best Practice:
    • Set custom alerts for lock escalation, deadlocks, and blocking sessions that exceed specified thresholds.
    • Create alerts for excessive logins, failed login attempts, or unusual access patterns for security monitoring.
    • Use custom alerts for sudden changes in query execution plans, which may indicate suboptimal plan choices or regressions due to outdated statistics.

9. Enable Automated Responses for Critical Alerts

Responding to alerts manually can be time-consuming, so SQL Server Agent allows you to define responses to specific alerts. Automated responses can include restarting services, running scripts, or adjusting resources temporarily to prevent further degradation.

  • Best Practice:
    • For critical alerts, configure automated responses such as restarting SQL Server services, clearing cache, or scaling up cloud resources if available.
    • Set automated scripts to collect additional diagnostics when an alert is triggered, helping capture valuable data for post-incident analysis.
    • Use escalation protocols to ensure that critical alerts that require manual intervention are immediately directed to the right team members.

10. Log Monitoring for Long-Term Insights

Long-term log monitoring is useful for understanding performance trends, identifying recurring issues, and tracking the impact of changes over time. SQL Server’s Error Log, Windows Event Log, and system_health Extended Events session are valuable sources of diagnostic information.

  • Best Practice:
    • Regularly review SQL Server Error Logs for messages related to I/O warnings, login failures, and deadlocks, and establish alerts for critical log entries.
    • Monitor Windows Event Logs for system-level alerts related to hardware failures, memory issues, or networking problems that could affect SQL Server performance.
    • Use log aggregation tools like Elasticsearch, Splunk, or Azure Monitor to centralize and analyze logs, allowing for faster identification of trends and potential issues.

Conclusion

Proactive monitoring and alerting ensure that SQL Server remains resilient, responsive, and optimized for performance over time. By defining KPIs, setting up automated alerts, monitoring query and resource usage, and utilizing both built-in and third-party tools, you can identify performance issues early and take corrective actions before they impact end-users. Implementing a structured monitoring and alerting strategy is essential for long-term SQL Server performance optimization and helps your team stay one step ahead of potential bottlenecks.

Performance Tuning Series – Regular Maintenance

SQL Server performance isn’t just about the initial setup or database design—it requires continuous maintenance to ensure it runs smoothly over time. Neglecting regular maintenance can lead to fragmentation, slow queries, data integrity issues, and ultimately, downtime. By implementing a comprehensive maintenance strategy, you can ensure that your SQL Server databases remain optimized and healthy, allowing them to perform efficiently even as workloads and data volumes grow.

Why Regular Maintenance is Critical

Over time, SQL Server databases accumulate various inefficiencies that can degrade performance. These include fragmented indexes, outdated statistics, growing transaction logs, and unused or bloated data. Regular maintenance tasks help to mitigate these issues, ensuring that SQL Server can continue to execute queries quickly, handle transactions efficiently, and maintain data integrity.

Key Regular Maintenance Tasks for SQL Server

1. Index Rebuilding and Reorganization

Indexes can become fragmented over time as data is inserted, updated, or deleted. Fragmentation occurs when the logical order of pages in an index no longer matches the physical order on disk. This leads to slower reads, as SQL Server must perform additional I/O to retrieve scattered data.

  • Rebuild Indexes: Index rebuilds recreate the index from scratch, removing fragmentation and improving query performance. This process locks the table, so it should be scheduled during periods of low activity.
  • Reorganize Indexes: Reorganizing indexes is a less intrusive process that defragments them without locking the table. This can be done during regular operations but is less effective than a full rebuild.

Best Practice:

  • Schedule regular index maintenance based on the level of fragmentation. Use SQL Server’s sys.dm_db_index_physical_stats DMV to check fragmentation levels:
    • 0-10% fragmentation: No action needed.
    • 10-30% fragmentation: Use index reorganization.
    • Above 30% fragmentation: Perform a full index rebuild.
  • Automate index maintenance using SQL Server Agent jobs or a dedicated maintenance tool to ensure this task is performed regularly without manual intervention.

2. Update Statistics

SQL Server uses statistics to estimate the distribution of data values in a table, which helps the query optimizer choose the most efficient execution plan. As data is modified, these statistics can become outdated, leading to suboptimal query plans and slower performance.

  • Best Practice:
    • Regularly update statistics on your tables and indexes to ensure that the query optimizer has the most accurate information. Use the UPDATE STATISTICS command or enable SQL Server’s auto-update statistics feature.
    • For large tables, use sampled statistics to balance performance with accuracy. Full scans of very large tables can be resource-intensive.
    • If queries slow down unexpectedly, manually update statistics to resolve potential performance issues caused by outdated statistics.

3. Backup and Recovery Management

Regular backups are essential for data protection and business continuity. However, improper backup strategies can lead to bloated transaction logs, excessive disk usage, and even performance degradation during peak times.

  • Best Practice:
    • Implement a full backup strategy based on your business’s recovery point objectives (RPO) and recovery time objectives (RTO). Schedule full backups regularly (e.g., daily) and transaction log backups more frequently (e.g., every 15-30 minutes) for critical databases.
    • Use differential backups between full backups to reduce the load on storage and improve recovery times.
    • Regularly test your backups by restoring them to a separate environment to ensure that they can be successfully recovered when needed.
    • Ensure that backup schedules avoid peak activity times to prevent any impact on performance.

4. Transaction Log Management

SQL Server’s transaction log records every modification made to the database. If not properly managed, the transaction log can grow excessively large, consuming valuable disk space and degrading performance.

  • Best Practice:
    • Use the Full Recovery Model for critical databases to ensure point-in-time recovery, but regularly back up the transaction logs to prevent them from growing too large.
    • For less critical databases or databases that don’t require point-in-time recovery, consider using the Simple Recovery Model, which automatically truncates the transaction log after each checkpoint.
    • Monitor transaction log size and schedule log backups frequently to avoid excessive growth. Use the sys.dm_db_log_space_usage DMV to monitor log space consumption.

5. Integrity Checks (DBCC CHECKDB)

Database corruption can occur for various reasons, such as hardware failures or improper shutdowns. SQL Server provides the DBCC CHECKDB command to detect and repair corruption in your databases.

  • Best Practice:
    • Run DBCC CHECKDB regularly to ensure data integrity. This process checks for physical and logical corruption in database files.
    • Schedule DBCC CHECKDB during off-peak hours to avoid performance impacts, as this operation can be resource-intensive.
    • If DBCC CHECKDB identifies corruption, address the issue immediately. Use repair options like REPAIR_ALLOW_DATA_LOSS as a last resort, and restore from backups when possible.

6. Tempdb Maintenance

Tempdb is a shared system database that is heavily used by SQL Server for temporary objects, intermediate query results, and sorting. Over time, tempdb can become a performance bottleneck if it is not properly managed.

  • Best Practice:
    • Ensure that tempdb has multiple data files, especially in high-concurrency environments. Best practice is to configure one data file per logical CPU core (up to 8 cores), which helps reduce contention on system pages (like PFS, GAM, and SGAM).
    • Place tempdb on fast storage (preferably SSD or NVMe) to handle its high I/O workload.
    • Regularly monitor tempdb space usage to avoid running out of space, which can lead to system crashes. Use sys.dm_db_task_space_usage and sys.dm_db_session_space_usage to track space consumption.

7. Cleanup of Unused or Outdated Data

Over time, databases may accumulate unused data, which can increase table sizes and slow down queries. Regularly cleaning up obsolete data ensures your database remains efficient.

  • Best Practice:
    • Implement a data retention policy that defines how long data should be kept before being archived or deleted. This policy should reflect business requirements while keeping database sizes manageable.
    • Periodically archive old data that is not frequently accessed into separate databases or storage systems.
    • Use automated scripts to clean up old or unused records, freeing up space and reducing index bloat.

8. Monitor and Tune Performance

SQL Server provides several tools for monitoring performance, including Dynamic Management Views (DMVs) and Extended Events. Regular monitoring can help identify performance bottlenecks before they affect end-users.

  • Best Practice:
    • Regularly monitor key performance metrics like CPU usage, memory usage, disk I/O, and query execution times to ensure the system is operating within optimal thresholds.
    • Use SQL Server Profiler or Extended Events to capture detailed information about query performance and diagnose slow-running queries.
    • Leverage DMV’s to analyze query patterns and suggest optimizations like new indexes.
    • Continuously review and tune your queries, indexes, and database schema based on real-time performance data.

9. Automating Maintenance Tasks

Manually managing routine maintenance tasks can be time-consuming and prone to error. SQL Server provides built-in automation tools, such as SQL Server Agent, to schedule and manage maintenance operations.

  • Best Practice:
    • Set up automated maintenance jobs for tasks like index rebuilding, statistics updates, transaction log backups, and integrity checks. This ensures that these critical operations are performed consistently and without manual intervention.
    • Regularly review and adjust job schedules to avoid conflicts during peak business hours.
    • Use maintenance plans in SQL Server Management Studio (SSMS) or third-party tools for more advanced scheduling and management of maintenance tasks.

Conclusion

Regular maintenance is essential for keeping your SQL Server database healthy and optimized for performance. Tasks like index rebuilding, updating statistics, managing transaction logs, performing integrity checks, and cleaning up obsolete data all contribute to the overall efficiency and reliability of your SQL Server environment. By automating maintenance operations, monitoring key performance metrics, and regularly tuning the system, you can ensure that your SQL Server databases continue to deliver optimal performance as your workload and data volumes grow.

Performance Tuning Series – Storage Optimization: Maximizing Disk Performance

Efficient storage management is critical for SQL Server performance, as disk I/O is often the slowest component in the entire system. Poor disk performance can cause bottlenecks, leading to slow query response times and general system sluggishness. Optimizing storage involves using the right hardware, configuring SQL Server for optimal use of that hardware, and regularly maintaining the data stored on disk.

Understanding the Role of Disk I/O in SQL Server

SQL Server heavily relies on disk I/O to store and retrieve data. Every query that retrieves data from a table, reads or writes logs, or handles tempdb operations, interacts with the disk. Efficient storage optimization can drastically reduce I/O latency and increase throughput, leading to faster query execution times. Key areas where disk I/O impacts performance include:

  • Data and Index Pages: Stored on disk and loaded into memory when queried.
  • Transaction Logs: Sequential writes to disk that track all database modifications.
  • Tempdb: A shared workspace for temporary data storage, often involving frequent disk I/O.
  • Backups and Restores: Operations that require significant disk activity.

To minimize the impact of disk I/O on performance, several best practices can help ensure SQL Server maximizes its disk performance.

Best Practices for SQL Server Storage Optimization

1. Use High-Performance Storage Solutions

The type of storage you choose for SQL Server has a significant impact on overall performance. Mechanical hard drives (HDDs) are slow and can cause performance bottlenecks, especially in high-transactional environments. Instead, use the following types of storage for better performance:

  • Solid-State Drives (SSDs): SSDs offer faster read/write speeds compared to traditional spinning disks (HDDs). SSDs reduce the time it takes to retrieve data from disk, making them ideal for SQL Server databases that require low-latency access.
    • Best Practice: Use SSDs for your data, log files, and tempdb. This will drastically reduce I/O wait times, leading to faster query response times.
  • NVMe Drives: NVMe (Non-Volatile Memory Express) drives provide even better performance than SSDs by using a direct connection to the CPU, bypassing the traditional SATA interface. NVMe drives can offer lower latency and higher throughput, making them ideal for databases with high I/O demands.
    • Best Practice: For mission-critical databases that handle large volumes of transactions or queries, consider using NVMe drives for primary storage.
  • SAN (Storage Area Network): For larger environments, a SAN can offer centralized, high-speed storage. Ensure that your SAN is properly configured to handle the database workload, with enough bandwidth and redundancy to avoid bottlenecks.

2. Separate Data, Log, and Tempdb Files

SQL Server performs different types of I/O operations on its data, transaction log, and tempdb files, and these should be managed separately for optimal performance:

  • Data Files (MDF/NDF): These files handle random I/O as SQL Server reads and writes data across different parts of the database.
  • Transaction Logs (LDF): Transaction logs are written sequentially, and disk I/O is generally sequential. Transaction logs require high write performance to ensure efficient logging and recovery.
  • Tempdb Files: Tempdb handles temporary objects and query operations, and it often experiences high I/O. High activity in tempdb can lead to contention and performance degradation.

Best Practice: Place data, log, and tempdb files on separate physical drives or storage volumes to prevent I/O contention. This ensures that heavy I/O on one file type (such as a data read) does not slow down other critical operations like logging or tempdb transactions.

3. Optimize I/O Through Disk Striping (RAID)

Redundant Array of Independent Disks (RAID) is a technology used to improve disk performance and redundancy by distributing data across multiple drives. Different RAID levels provide varying balances of performance, redundancy, and cost.

  • RAID 1 (Mirroring): Provides redundancy by duplicating data across two drives. It offers fault tolerance but no performance benefits.
  • RAID 5 (Striping with Parity): Distributes data across several disks, with parity for fault tolerance. RAID 5 improves read performance but may suffer from slow write performance due to the overhead of parity calculations.
  • RAID 10 (Mirroring and Striping): Combines RAID 1 and RAID 0 to provide both redundancy and performance. RAID 10 offers faster read/write speeds and is ideal for high-performance SQL Server environments, although it requires more drives and is costlier.

Best Practice: For SQL Server, RAID 10 is often recommended for data files due to its balance of performance and fault tolerance. Transaction logs benefit from RAID 1, as sequential writes don’t require the parity overhead of RAID 5.

4. Optimize Tempdb Performance

Tempdb is a shared system database that handles temporary data, intermediate results for queries, and row versioning. It can become a significant performance bottleneck, especially in high-concurrency environments.

  • Best Practice: To optimize tempdb:
    • Use multiple tempdb files: SQL Server allows you to configure multiple tempdb data files to reduce contention and improve throughput. Ideally, you should have one tempdb file per logical CPU core (up to 8 cores).
    • Place tempdb on fast storage: Since tempdb is highly I/O-intensive, place it on the fastest storage available (preferably SSD or NVMe).
    • Monitor tempdb usage: Regularly monitor tempdb for signs of contention (such as high waits on PFS, GAM, or SGAM pages). This can indicate the need for additional tempdb files or further optimization.

5. Monitor Disk I/O Performance

Regularly monitoring disk performance is essential to identify and address bottlenecks before they affect SQL Server. You can use SQL Server’s built-in tools and OS-level monitoring tools to track I/O performance.

  • Best Practice: Monitor the following key metrics:
    • Disk Latency: Track disk latency (measured in milliseconds). Ideally, disk read/write latency should be under 10ms for SSDs and under 1ms for NVMe drives. High latency indicates storage performance issues.
    • Disk Queue Length: This metric shows how many requests are waiting to be processed by the disk. Long disk queues indicate that SQL Server is overloading the storage subsystem.
    • Read/Write IOPS: Input/output operations per second (IOPS) provide a measure of how efficiently your storage can handle the database’s read/write workload. Compare actual IOPS with the capacity of your storage hardware to ensure it meets the demand.
  • Tools for Monitoring:
    • SQL Server Performance Monitor (PerfMon): Tracks disk performance counters like Avg. Disk sec/Read and Avg. Disk sec/Write, providing insight into disk latency.
    • SQL Server Dynamic Management Views (DMVs): DMVs like sys.dm_io_virtual_file_stats offer real-time insights into SQL Server disk I/O activity at the database and file level.

6. Enable Data Compression

SQL Server offers data compression features that can reduce the size of data stored on disk, leading to lower storage requirements and potentially improved performance by reducing I/O.

  • Best Practice: Consider enabling row-level or page-level compression on tables that experience heavy read activity. Compression reduces the number of data pages SQL Server has to read from disk, decreasing I/O and improving query performance.
    • Row-Level Compression: Minimizes the storage footprint of individual rows without adding significant CPU overhead.
    • Page-Level Compression: Compresses data at the page level, providing greater space savings, but requires more CPU resources.

Regularly review data access patterns to determine which tables or indexes would benefit most from compression, particularly in environments with large datasets and frequent queries.

7. Regular Index Maintenance

Fragmented indexes can cause SQL Server to perform extra I/O when retrieving data, leading to performance issues. Regular index maintenance ensures that SQL Server performs efficiently.

  • Best Practice: Rebuild or reorganize fragmented indexes periodically to optimize disk usage and reduce unnecessary I/O.
    • Use index rebuilds for heavily fragmented indexes (over 30% fragmentation) to completely rebuild the index structure.
    • Use index reorganization for moderately fragmented indexes (10-30% fragmentation) to re-sort data pages without fully rebuilding the index.

Automate index maintenance tasks to ensure they are regularly performed without manual intervention.

Conclusion

Storage optimization is key to achieving high performance in SQL Server environments. By using the right storage hardware, segregating data, log, and tempdb files, utilizing RAID configurations, and regularly monitoring disk performance, you can minimize I/O bottlenecks and ensure your SQL Server operates efficiently. When combined with regular index maintenance, compression, and proper tempdb management, a well-optimized storage system forms the foundation of a performant SQL Server instance.

Performance Tuning Series – Memory Management

Memory management plays a pivotal role in SQL Server performance. SQL Server uses memory for various purposes, including caching data, storing query plans, and running queries. Proper memory configuration ensures that SQL Server uses resources efficiently, providing optimal query response times and preventing performance degradation. Mismanagement, however, can lead to high memory pressure, slow query execution, or even out-of-memory errors.

SQL Server’s Memory Architecture

SQL Server primarily relies on two types of memory: Buffer Pool and Query Workspace Memory. The Buffer Pool is responsible for caching data pages to reduce disk IO operations, while Query Workspace Memory is used for sorting, hashing, and other operations that require in-memory processing during query execution. Understanding how SQL Server uses memory can help in diagnosing and optimizing memory-related issues.

Best Practices for Memory Management

  1. Set Appropriate Maximum and Minimum Memory Limits:
    • SQL Server dynamically allocates memory, but by default, it can use almost all available system memory, potentially starving other processes (including the operating system) of necessary resources. To prevent this, it’s essential to configure the Maximum Server Memory setting in SQL Server.
    • Best Practice: Set the max server memory to leave sufficient memory for the OS and other critical processes. A general recommendation is to reserve around 10-20% of the total system memory for the operating system.
    • Example: If your server has 32 GB of RAM, you might configure SQL Server to use 25-28 GB, leaving 4-6 GB for the OS and other applications.
    • The min server memory setting is usually less critical but can be useful in environments where SQL Server competes with other applications for memory. Setting a reasonable minimum ensures that SQL Server has a baseline of memory even during high competition for system resources.
  2. Monitor and Manage Memory Pressure:
    • Memory pressure occurs when SQL Server runs low on available memory for operations, leading to performance degradation. There are two main types of memory pressure: internal (caused by SQL Server needing more memory than what’s allocated) and external (caused by other processes on the same server consuming memory).
    • Best Practice: Monitor key indicators like page life expectancy (PLE), which measures how long a page stays in the buffer pool before being flushed out. A rapidly declining PLE may signal memory pressure, as pages are being flushed from memory too quickly. Values under 300 seconds typically indicate memory pressure.
  3. Optimize Buffer Pool Usage:
    • SQL Server’s Buffer Pool is a crucial area of memory used to cache frequently accessed data pages, reducing the need for disk IO, which is much slower. Efficient buffer pool management can drastically improve database performance by minimizing physical reads.
    • Best Practice: Ensure that enough memory is available to store hot data sets in the buffer pool. Regularly accessed tables and indexes should ideally fit into memory to avoid constant paging to and from disk.
    • Use the sys.dm_os_buffer_descriptors DMV to monitor buffer pool utilization and identify which database pages are consuming the most memory. If large, rarely used tables are consuming too much memory, consider indexing or partitioning strategies to optimize memory usage.
  4. Monitor Query Workspace Memory:
    • Query Workspace Memory is used for internal operations like sorting, hashing, and other in-memory data processing tasks. If these operations consume too much memory, SQL Server will spill them to disk, significantly slowing down query execution due to the additional IO overhead.
    • Best Practice: Monitor the sort warnings and hash warnings using the sys.dm_exec_query_stats DMV. These warnings indicate that SQL Server ran out of memory and had to spill to disk during a query operation. If such warnings are frequent, consider increasing the available memory or optimizing the queries involved to use less memory.
    • Query operations that sort large result sets or perform complex joins are often memory-intensive. You can reduce memory consumption by rewriting queries to process fewer rows, adding indexes to avoid large sorts, or splitting the workload into smaller, more manageable batches.
  5. Control Memory for In-Memory OLTP:
    • SQL Server offers In-Memory OLTP (also known as Hekaton), which stores data in memory-optimized tables, providing faster read and write access. However, In-Memory OLTP comes with its own memory management considerations since all data in memory-optimized tables must fit into memory.
    • Best Practice: Ensure that the server has sufficient memory to store both memory-optimized tables and other critical SQL Server processes. Set a dedicated memory pool for In-Memory OLTP using the memory_optimized_data configuration. This helps SQL Server manage how much memory can be used for In-Memory OLTP without starving other processes.
    • Monitor the memory usage of In-Memory OLTP via the sys.dm_db_xtp_table_memory_stats DMV to ensure it’s functioning efficiently and not consuming an excessive amount of memory.
  6. Optimize SQL Server for NUMA (Non-Uniform Memory Access) Architecture:
    • NUMA is a memory architecture that divides memory into nodes associated with specific CPUs. SQL Server is NUMA-aware and can optimize memory usage based on the NUMA configuration, improving performance for multi-CPU systems.
    • Best Practice: Ensure that SQL Server is correctly configured to take advantage of NUMA. If SQL Server is running on a NUMA-enabled server, monitor NUMA node memory allocation using the sys.dm_os_nodes DMV. SQL Server can experience bottlenecks if memory allocations are not balanced across NUMA nodes, so check for uneven workloads across nodes.
    • If necessary, configure SQL Server’s affinity mask settings to control which CPUs and NUMA nodes SQL Server uses, ensuring that memory access remains efficient.
  7. Cache and Plan Management:
    • SQL Server caches query execution plans in memory to avoid recompiling the same queries repeatedly, reducing CPU load and speeding up query execution. However, inefficient query plans or cache bloating can waste memory and degrade performance.
    • Best Practice: Regularly monitor the plan cache using the sys.dm_exec_cached_plans DMV to identify and remove inefficient or rarely used plans. You can also look for parameter sniffing issues, where SQL Server generates an inefficient plan based on initial parameter values and reuses it for other queries, even if it’s not optimal.
    • Use optimize for ad hoc workloads configuration to reduce memory consumption by ad hoc queries. This setting caches only the plan stub for single-use queries, instead of the full plan, reducing memory overhead for queries that are executed only once.

Monitoring and Diagnosing Memory Issues

    • SQL Server provides several dynamic management views (DMVs) to help you monitor memory usage:
      • sys.dm_os_sys_memory: Provides an overview of the system’s memory usage, including total memory, available memory, and memory pressure status.
      • sys.dm_os_memory_clerks: Shows detailed information about memory clerks, which are internal components that track memory usage for various SQL Server operations like buffer pool and query execution.
      • sys.dm_exec_memory_grants: Displays memory grants for currently executing queries, helping to identify queries that are consuming large amounts of memory.
    • Regularly review these DMVs to ensure memory is being used efficiently, and address any queries or operations that are causing excessive memory consumption.

Conclusion

Efficient memory management is crucial for ensuring SQL Server performs at its best. By setting appropriate memory limits, monitoring key metrics, and optimizing memory usage across the buffer pool, query workspace, and In-Memory OLTP, you can prevent memory bottlenecks and ensure that your database server runs smoothly. Proper memory management, combined with regular monitoring, allows you to proactively address issues and maintain optimal performance for your SQL Server instances.

Get Ahead of Year-End with Bulletproof Database Solutions

As we approach the final stretch of the year, businesses across all industries are gearing up for the increased demands that come with Q4. From handling higher transaction volumes to meeting year-end reporting requirements, your SQL databases will be put to the test. At SQL Freelancer, we understand the critical role that a robust, secure, and optimized database plays in ensuring your operations run smoothly during this peak season.

Why Your Q4 Success Depends on Your Database

The last quarter of the year can be a make-or-break time for many businesses. Whether you’re dealing with a surge in online orders, closing out the fiscal year, or preparing for tax season, your database needs to perform at its best. Any hiccups in your database can lead to delays, data loss, or even security breaches, all of which can severely impact your bottom line.

This is where SQL Freelancer comes in. Our Q3 marketing campaign, “Prepare for Q4 with SQL Expertise,” is designed to help you proactively address potential issues before they arise. By partnering with us, you can ensure that your SQL solutions are ready to handle whatever Q4 throws your way.

What We Offer:

  • Comprehensive Database Audits: We’ll perform a thorough analysis of your current database setup, identifying any weaknesses or areas for improvement.
  • Security Enhancements: Protect your data from breaches with our advanced security measures tailored to your specific needs.
  • Performance Optimization: Ensure your databases run efficiently under heavy loads, reducing latency and improving user experience.
  • Scalability Planning: Prepare for growth by ensuring your databases can scale seamlessly with your business needs.

Don’t Let Your SQL Databases Fall Behind

As you gear up for Q4, don’t let your SQL databases be an afterthought. With SQL Freelancer by your side, you can be confident that your solutions are secure, optimized, and ready for anything. We’re committed to helping you prepare, protect, and excel—so you can focus on what you do best.

Partner with the Leader in SQL Solutions

At SQL Freelancer, we pride ourselves on being a leader in SQL solutions. Our team of experts is dedicated to providing top-notch service, tailored to your unique business needs. Don’t leave your Q4 success to chance—partner with us and get ahead of the curve.

Ready to get started? Contact us today to learn how we can help you prepare for Q4 with bulletproof database solutions.

Introducing database watcher for Azure SQL

Reliable, in-depth, and at-scale monitoring of database performance has been a long-standing top priority for SQL customers. Today, we are pleased to announce the public preview of database watcher for Azure SQL, a managed database monitoring solution to help our customers use Azure SQL reliably and efficiently.


Managed monitoring for Azure SQL

To enable database watcher, you do not need to deploy any monitoring infrastructure or install and maintain any monitoring agents. You can create a new watcher and start monitoring your Azure SQL estate in minutes.


Once enabled, database watcher collects detailed monitoring data from your databases, elastic pools, and managed instances into a central data store in your Azure subscription. Data is collected with minimal latency – when you open a monitoring dashboard, you see database state as of just a few seconds ago.

Read more here…

Always On Availability Group Latency Reports

With SQL Server 2012 we introduced Always On Availability Groups, and the Always On Availability Group Dashboard in SQL Server Management Studio (SSMS). This dashboard can be utilized by database administrators to view the current health of an Availability Group and its availability replicas and databases. While the dashboard can be configured to provide information regarding the latency between Primary and Secondary Replicas (can be calculated using the Commit LSN, Sent LSN and harden LSN values), it does not provide insights into the reason for the latency. To understand the reason for latency, requires capture and analysis of Extended Events and Performance Monitor counters. This activity can be time consuming and requires extensive knowledge of the Extended Events associated with Always On.

With the new SSMS 17.4 release, we are introducing the Availability Group Latency data collection and reporting built into the Availability Group dashboard. This feature masks the capture and analysis of the Extended Events from the end user and provides an easy to understand report detailing the time spent during the various phases of the Log Transport process.

What to use it for?

The Latency data collection functionality and the associated reports allows a database administrator to quickly discern the bottleneck in the log transport flow between the Primary and the Secondary replicas of an Availability Group. This feature does NOT answer the question “Is there latency in the Availability Group deployment?” but rather provides a way to understand why there is latency in the Availability Group Deployment. This functionality provides a way to narrow down the potential cause of latency in an Availability Group deployment.

How does it Work?

As seen below, the Availability Group Latency Data Collection functionality can be accessed from the Availability Group Dashboard.

Click here to view the rest of this post.

SQL Server Performance Dashboard Reports

SQL Server 2012 Performance Dashboard Reports is one of most popular SQL Server monitoring solution for customers and SQL community leveraging dynamic management views (DMVs) for monitoring and reporting and available at no cost to consumers. SQL Server Performance Dashboard Reports are available as a set of custom reports in SQL Server Management Studio (SSMS) which runs against the connected instance in Object Explorer. When monitoring large enterprise deployments of SQL Server, hosting SQL Server Performance Dashboard Reports on a central reporting server can provide additional benefits making life easier for enterprise DBAs for monitoring and troubleshooting SQL Server issues. To support hosting SQL performance dashboard reports on a central SQL Server Reporting Services instance, we have customized SQL Server 2012 Performance Dashboard Reports, added new reports and uploaded in Tiger toobox github repository for customers and SQL community. The reports are tested to run against SQL Server 2012, SQL Server 2014 and SQL Server 2016 versions of target SQL Server instance and can be deployed against SQL Server 2012, SQL Server 2014 or SQL Server 2016 Reporting Services instance.

Following are some of the benefits of hosting SQL Performance dashboard reports on central SSRS reporting server.

  • Monitoring Reports accessible anytime, anywhere using browser – This removes the dependency of thick client like SQL Server Management Studio (SSMS) to be present on the workstation server allowing DBAs, DevOps audience to check the health of SQL Server and resource consumption using web browser from any workstation machine with access to the server.
  • Scheduling automatic report delivery – SSRS allows scheduled email or file share delivery of reports. This allows DBAs, application owners and database stakeholders to choose push model where by performance health reports can be scheduled to run against specified SQL Server instances at the specified time and be delivered in their mailbox to proactively monitor overall health of SQL Server instance and detect any anomaly.
  • Performance Base lining using Report Snapshots – SSRS allows you to capture scheduled point in time report snapshots at the specified time interval allowing DBAs to establish performance baselines using historical snapshots for the target SQL Server instances.
  • Linked Reports for Application owners and other stakeholders – In an enterprise environment, most application teams and stakeholders are interested to see the performance, resource consumption, blocking information and overall health of their SQL Server instance on-demand. In such scenarios, DBAs can create linked reports for the target SQL Server instances on the SSRS central server and delegate them permissions to view reports for their target SQL Server instance of interest. This allows application teams, developers to be self-sufficient to check the overall health of their SQL Server instances creating some bandwidth for DBAs who needs to be contacted only if there is an anomaly or problem detected.

Click here to view the rest of this post.

Capturing Deadlocks with Extended Events

I’ve been noticing a lot of deadlocks on my server. What’s the best way to track down the queries so I can fix the problem?

There are a few different ways that you can capture deadlock information. You can setup a trace flag (1222) to write the deadlock information to the error log, setup a Profiler trace to capture the deadlock graph, or setup an Extended Event to capture all sorts of information.

I’m going to focus on setting up an Extended Event in this post since MS continues to say Profiler will not be released in future versions. Extended Events are the future so why not start using them now?

In SSMS, drill down to Management, Extended Events. Right click on Sessions and click New Session Wizard:

Deadlocks with Extended Events 1

Click next on the Introduction screen and give the Session a name. I’m going to name this session Deadlocks:

Deadlocks with Extended Events 2

Click next. On the Choose Template screen you can choose a predefined template (like Profiler) or you can create your own events by choosing “Do not use a template”. For this post, let’s create our own:

Deadlocks with Extended Events 3

Click next and you’ll see hundreds of events (like Profiler). We only want to capture deadlock data so let’s scroll down to the very bottom and choose xml_deadlock_report. Click on the event and click the right arrow to move it into the Selected Events box:

Deadlocks with Extended Events 4

You can choose other events if needed, but for the simplicity of this post I’m just going to use this one. Click next. The Capture Global Fields page allows us to select what fields we want to capture. These are unique to each event selected. For this example, I’ll choose the following fields:

  • Callstack
  • Client_app_name
  • Client_hostname
  • Database_id
  • Database_name
  • Plan_handle
  • Process_id
  • Sql_text
  • Transaction_id
  • Transaction_sequence

Deadlocks with Extended Events 5

Click next. On this page you can apply filters if needed. I’ll setup a filter so that I only capture data from the RollTide database. There are hundreds of different filters that can be configured so that you don’t pull back data that is not needed:

Deadlocks with Extended Events 6

Click next to the Session Data Storage page. This page allows you to save data to a file or work with only the most recent data. I don’t want to keep thousands upon thousands of events so I’ll choose “Work with only the most recent data”

Deadlocks with Extended Events 7

The next page summarizes all the options we have selected. You can also script this session if you need to create it on other servers or save it for later. Click Finish to create the new session.

The last page allows you to start the session immediately and watch live data. For this post, I’ll choose both:

Deadlocks with Extended Events 8

You should see the new session under Extended Events and the Live Data tab should appear:

Deadlocks with Extended Events 9

Deadlocks with Extended Events 10

Once a deadlock occurs it should show the deadlock in the Live Data window:

Deadlocks with Extended Events 11

This view shows all of the fields we selected including the XML report. If you click on the Deadlock tab, you’ll see the graph:

Deadlocks with Extended Events 12

You can also use this query to see detailed information including the Deadlock graph and Event XML

SELECT
DATEADD(mi, DATEDIFF(mi, GETUTCDATE(), CURRENT_TIMESTAMP), DeadlockEventXML.value('(event/@timestamp)[1]', 'datetime2')) AS [EventTime],
DeadlockEventXML.value('(//process[@id[//victim-list/victimProcess[1]/@id]]/@hostname)[1]', 'nvarchar(max)') AS HostName,
DeadlockEventXML.value('(//process[@id[//victim-list/victimProcess[1]/@id]]/@clientapp)[1]', 'nvarchar(max)') AS ClientApp,
DB_NAME(DeadlockEventXML.value('(//process[@id[//victim-list/victimProcess[1]/@id]]/@currentdb)[1]', 'nvarchar(max)')) AS [DatabaseName],
DeadlockEventXML.value('(//process[@id[//victim-list/victimProcess[1]/@id]]/@transactionname)[1]', 'nvarchar(max)') AS VictimTransactionName,
DeadlockEventXML.value('(//process[@id[//victim-list/victimProcess[1]/@id]]/@isolationlevel)[1]', 'nvarchar(max)') AS IsolationLevel,
DeadlockEventXML.query('(event/data[@name="xml_report"]/value/deadlock)[1]') AS DeadLockGraph,
DeadlockEventXML
FROM
(
SELECT
XEvent.query('.') AS DeadlockEventXML,
Data.TargetData
FROM
(
SELECT
CAST(target_data AS XML) AS TargetData
FROM sys.dm_xe_session_targets st
JOIN sys.dm_xe_sessions s ON s.address = st.event_session_address
WHERE s.name = 'Deadlocks' AND
st.target_name = 'ring_buffer'
) AS Data
CROSS APPLY TargetData.nodes('RingBufferTarget/event[@name="xml_deadlock_report"]') AS XEventData(XEvent)
) AS DeadlockInfo 

Managing the size of the SQL Server SSIS catalog database

The SSIS catalog is the central point for working with Integration Services (SSIS) projects that you’ve deployed to the SSIS server. When the SSIS catalog is implemented, the SSISDB database is automatically created. The scope of this post will focus on the SSISDB growth more than the SSIS catalog itself.

SSIS projects, packages, parameters, environments, and operational history are all stored in the SSISDB database so if you have hundreds of SSIS packages or packages that run every few minutes you could see how the database storing all the historical information would grow exponentially.

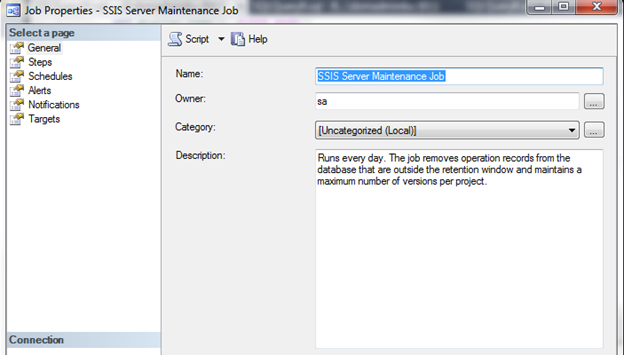
Also included when you enable this feature is a SQL Server Agent Job called SSIS Server Maintenance job:

SQL Freelancer SSIS Catalog 1
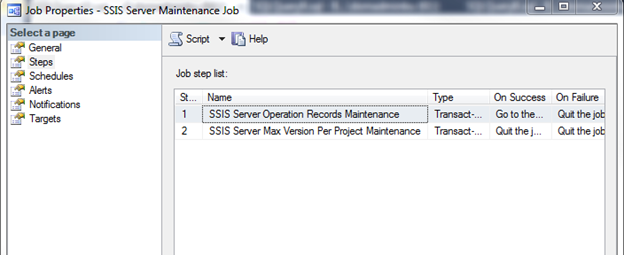
Inside this job are two steps, SSIS Server Operation Records Maintenance and SSIS Server Max Version Per Project Maintenance, that will help clean up the database. By default, this job is set to run at 12:00am nightly which is sufficient:

SQL Freelancer SSIS Catalog
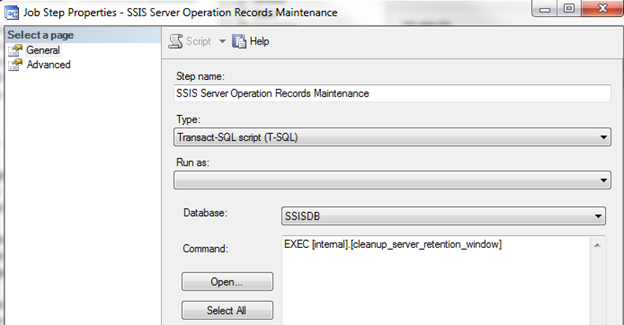
Looking at the first step, SSIS Server Operations Records Maintenance, you will notice that it executes a stored procedure named internal.cleanup_server_retention_window. This sounds like it could be the stored procedure that cleans up history:

SQL Freelancer SSIS Catalog
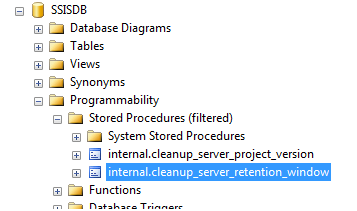
Let’s browse out to the stored procedure in Management Studio and take a look at the code:

SQL Freelancer SSIS Catalog
You can see from the very beginning of the stored procedure in the BEGIN TRY statement it first looks to see if Operation cleanup is enabled and if cleanup is enabled then it looks for the Retention Window:

SQL Freelancer SSIS Catalog
Click here to view the rest of this post.