Creating an Azure Windows VM seems pretty easy, but there are a lot of settings to be careful of before hitting the Create button. In this post, we’ll go over some of those so the next (or first) time you create an Azure VM, you’ll be ready!
Here we go….
Log into the Azure portal and click Virtual Machines and Create Virtual Machine:
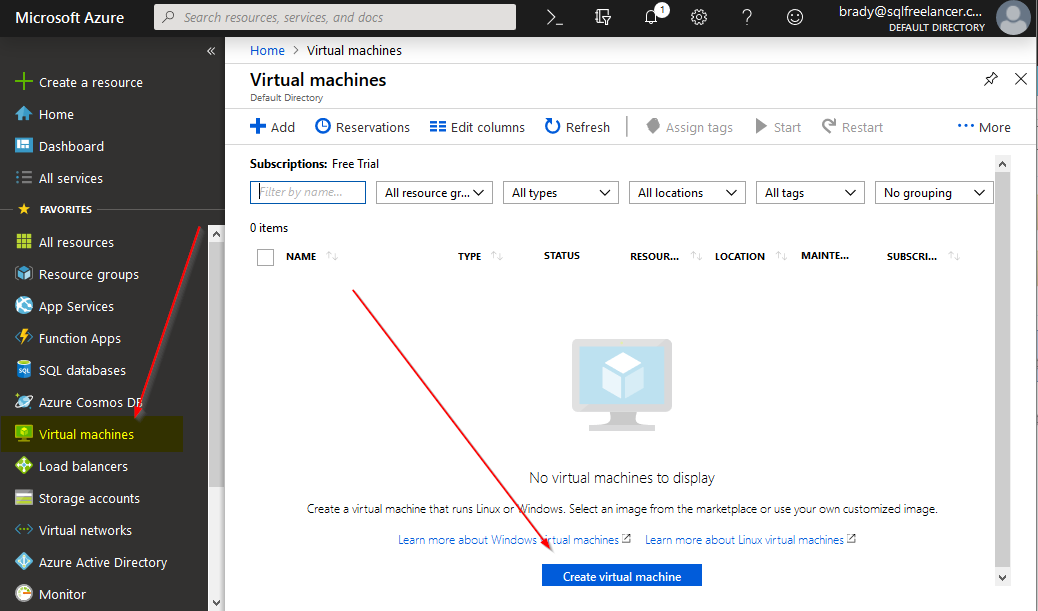
Note: I’m using a free trial.
Under the Basics tab, there are a few options. Let’s start at the top.
Subscription: An Azure subscription is the agreement with Microsoft to use Azure, for which charges accrue. You can create multiple subscriptions to separate billing or management.
Resource Group: A container that holds related resources for an Azure solution. The resource group includes those resources that you want to manage as a group. You decide how to allocate resources to resource groups based on what makes the most sense for your organization.
Virtual machine Name: The identifier and host name for the VM.
Region: The region in which your VM will reside. To see more go here: https://azure.microsoft.com/en-us/global-infrastructure/regions/
Availability Options:
- No infrastructure redundancy required: No High Availability.
- Availability Zone: VM’s are in a different physical location within an Azure region. This offers 99.99% SLA.
- Availability Set: A group with two or more virtual machines in the same Data Center is called Availability Set, this ensures that at least one of the virtual machines hosted on Azure will be available if something happens. This configuration offers 99.95% SLA.
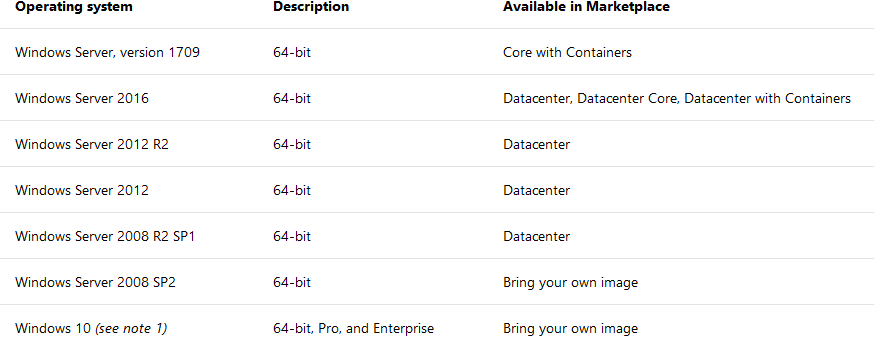
Image: The base Operating System for the VM. The following Windows versions are supported. https://docs.microsoft.com/en-us/azure/azure-stack/azure-stack-supported-os
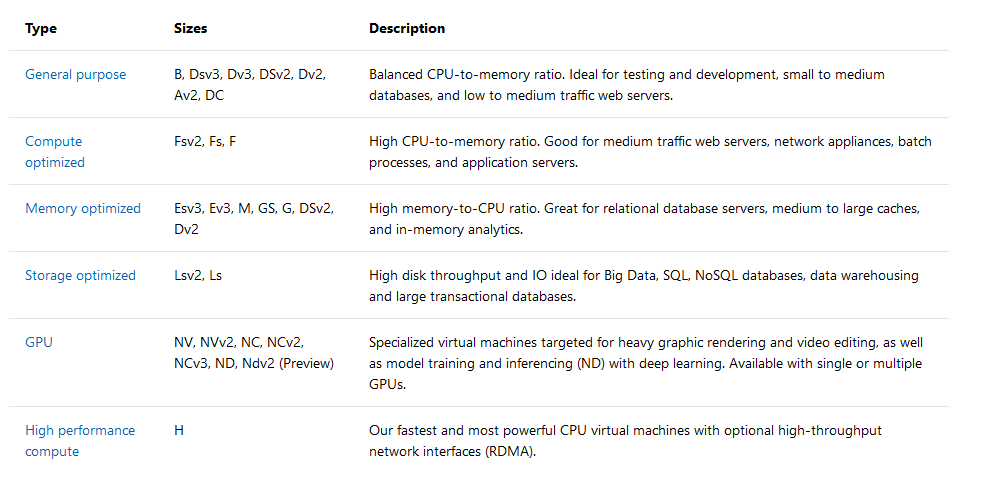
 Size: This is the size of the VM. Here’s a good chart to use when sizing. Remember, pricing! Another cool thing with Azure is that you can resize pretty easy by shutting down the VM, resizing it, and restarting. Of course, this depends on your region and availability options. https://docs.microsoft.com/en-us/azure/virtual-machines/windows/sizes
There’s also a free tool on the web that will help you size your VM based on certain resources. https://www.vmchooser.com/vmchooser
Username: The administrator username for the VM
Password: The administrator password for the VM
Public inbound ports: Ports that are accessible from the public internet.
Already have a Windows license?: You can save money if you already have a Software Assurance license or an Active Windows server subscription.
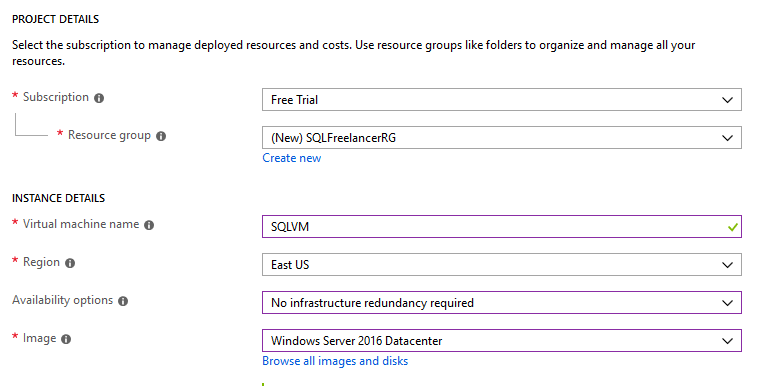
In my example, I’m using a Free Trial, so that’s the only option for Subscription. For Resource Group, let’s create a new group (by clicking Create New), named SQLFreelancerRG.
I’ll name my VM SQLVM, put it in the East Region, with no redundancy and a fresh copy of Windows Server 2016 DataCenter.
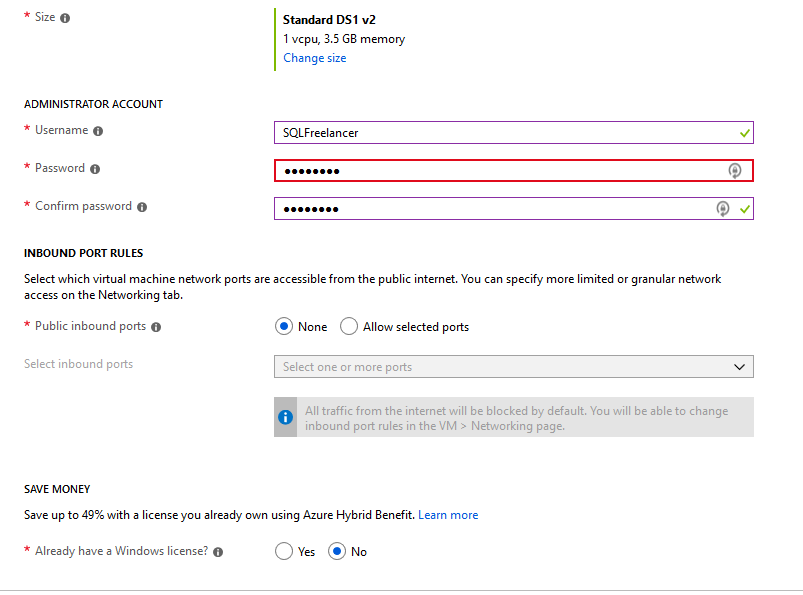
Next, I’ll size this VM with the Standard DS1 v2, which is going to give me 1vCPU and 3.5GB RAM. I’ll create an Administrator account, allow no ports from the public internet and choose No for the Azure Hybid Benefit.
The next page is all about the Disks. https://docs.microsoft.com/en-us/azure/virtual-machines/windows/about-disks-and-vhds
OS disk type: This is type of disks we can use for the VM. Let’s look at Standard vs. Premium:
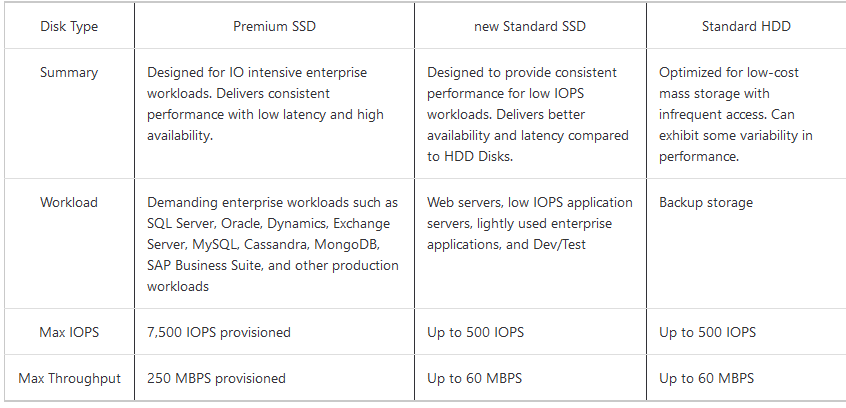
You can also create and attach a new disk or attach an existing disk (from snapshot of another disk or BLOB storage)
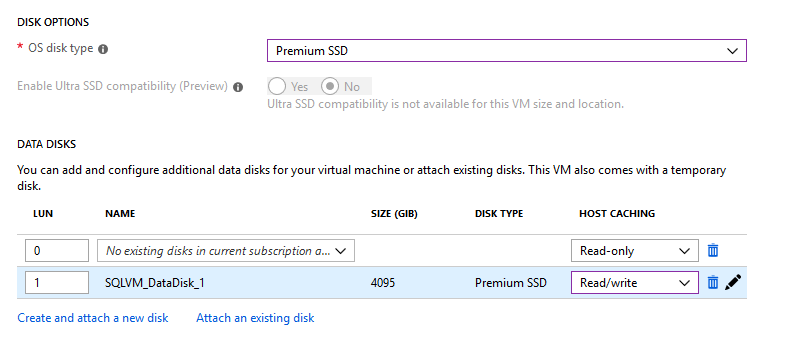
In my example, I’ll use a Premium SSD disk and I’ll create a second disk called SQLVM_DataDisk_1.
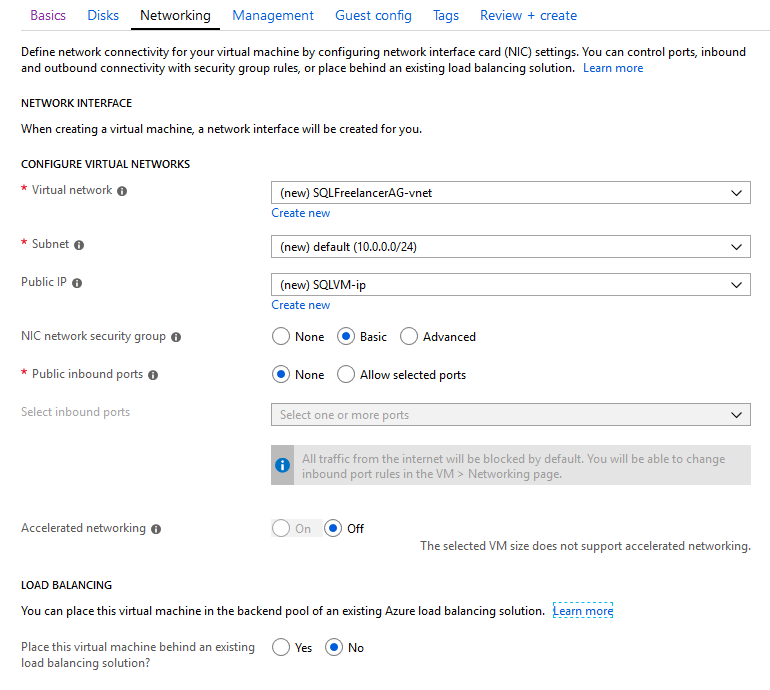
The next page gets into a little Networking. https://docs.microsoft.com/en-us/azure/virtual-machines/windows/network-overview
Virtual Network: A virtual network enables VM’s to communicate privately with each other, and with the internet.
Subnet: The subnet is the range of IP addresses in the Virtual Network.
Public IP: Public IP addresses allow Internet resources to communicate inbound to Azure resources. Public IP addresses also enable Azure resources to communicate outbound to Internet and public-facing Azure services with an IP address assigned to the resource. The address is dedicated to the resource, until it is unassigned by you. If a public IP address is not assigned to a resource, the resource can still communicate outbound to the Internet, but Azure dynamically assigns an available IP address that is not dedicated to the resource.
NIC network security group: Security rules in network security groups enable you to filter the type of network traffic that can flow in and out of virtual network subnets and network interfaces.
Public inbound ports: Ports that are accessible from the public internet.
Accelerated Networking: Enables low latency and high throughput on the network interface.
Load Balancing: Azure Load Balancer delivers high availability and network performance to your applications. A load balancer can be configured to balance incoming Internet traffic to VMs or balance traffic between VMs in a VNet. A load balancer can also balance traffic between on-premises computers and VMs in a cross-premises network, or forward external traffic to a specific VM.
For this post, I’m just going to use the defaults and move forward.
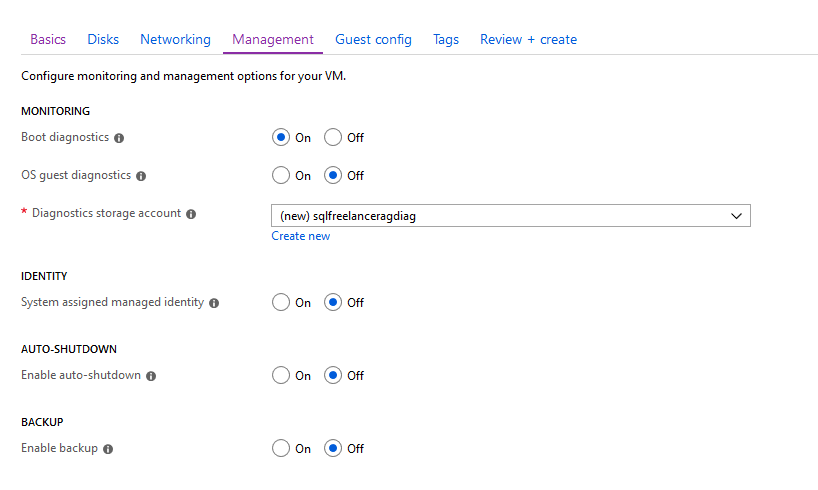
Next up is Monitoring. https://docs.microsoft.com/en-us/azure/virtual-machines/windows/monitor
Boot diagnostics: As VMs boot, the boot diagnostic agent captures boot output and stores it in Azure storage. This data can be used to troubleshoot VM boot issues.
OS guest diagnostics: Allows you to get metrics every minute for your VM. You can use them to create alerts and stay informed.
Diagnostics storage account: The storage account in which your diagnostics are stored.
System assigned managed identity: Managed identities for Azure resources provides Azure services with an automatically managed identity in Azure Active Directory. You can use this identity to authenticate to any service that supports Azure AD authentication, without having credentials in your code. https://docs.microsoft.com/en-us/azure/active-directory/managed-identities-azure-resources/qs-configure-portal-windows-vm
Enabled auto-shutdown: Configures your VM to automatically shutdown each day.
Enable backup: Auto backup for your VM.
I’m going to keep defaults and click Next.
The next page is Guest Config where you can add additional configuration, scripts, agents, or applications via VM extensions. Click Next.
Tags are name values pairs that enable you to categorize resources and view consolidated billing. Think of this as Twitter hashtag.
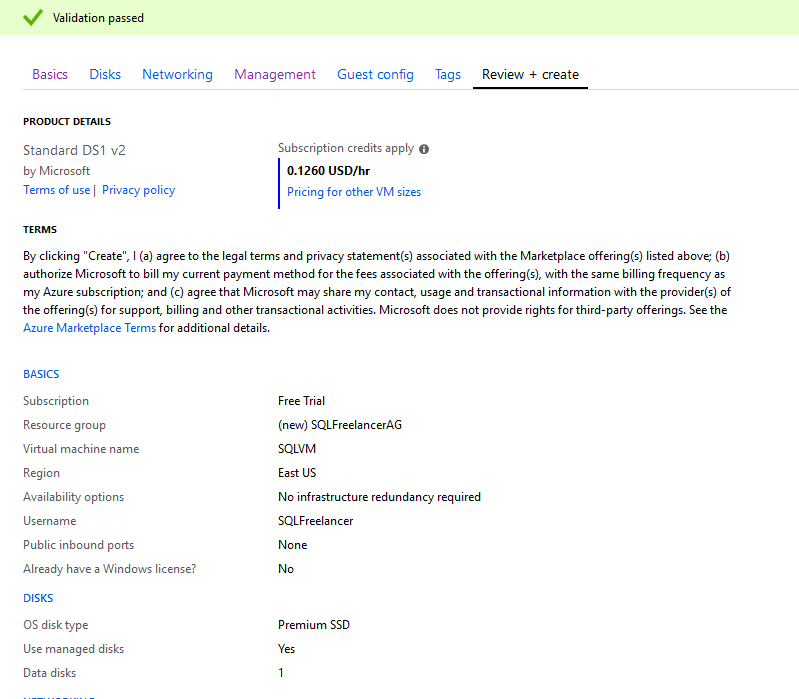
Last page is Review and Create. This is the page that displays a summary of our selections including price per hour of uptime. You’ll also notice at the bottom there is a link that will allow you to download a template for automation. This will allow you to use the same specs that you created for this VM on other VM’s. Click Create to build your new VM.
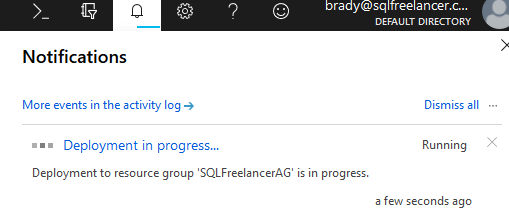
If you click on the Notification Bell at the top of the portal, you’ll see that Deployment is in progress.
Once the VM is created, you can click Virtual Machines from the Favorite Bar and view your newly created VM:
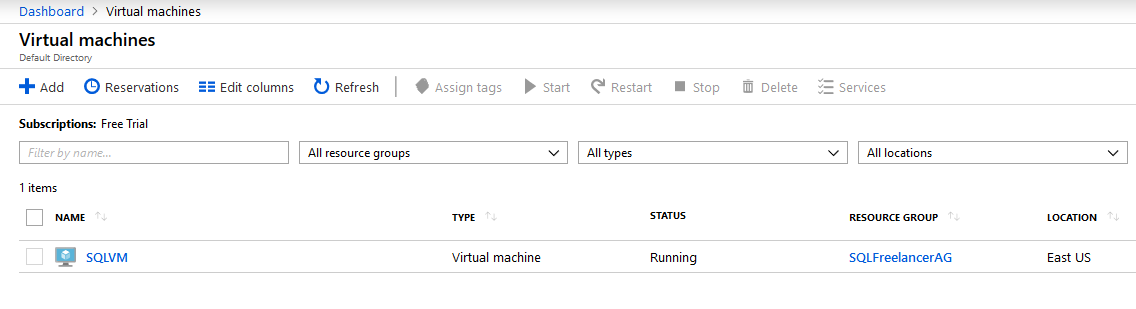
If you click on the new VM it will bring up the Overview page (along with tons of other pages to choose from).
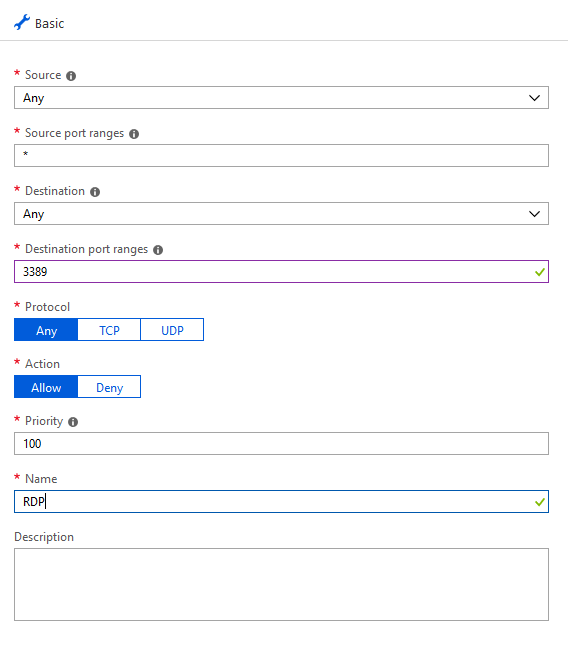
Click on the Networking tab and Add inbound port rule. Under Destination Port Range type 3389 and under Name type RDP inbound. This will allow RDP access.
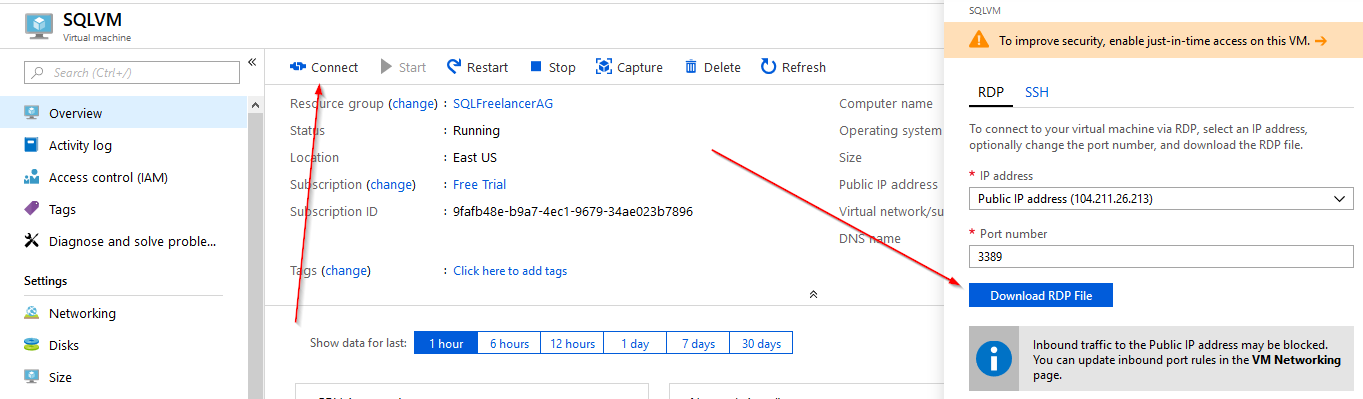
Click Connect and Download RDP file to remote into the server.
TADA!